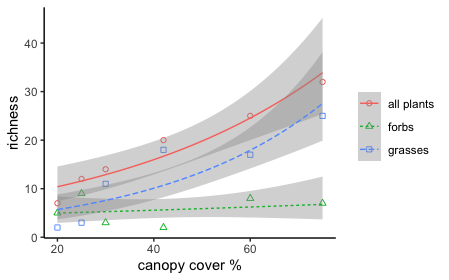
I want to compare three versions of the same count response variable using Poisson regression. Can I make comparisons based on how significant the predictor coefficient is, and can I put the results in the same plot? The significance of the coefficients in each model suggest (or so I'd like to think) that grass richness and not forb richness can be predicted based on the canopy cover. Is there a better approach?
y1 = c(14, 20, 25, 32, 7, 12) # all plant richness (total number of species)
y2 = c(11, 18, 17, 25, 2, 3) # grass species richness
y3 = c( 3,  2,  8,  7, 5, 9) # forb richness
# note that y2 + y3 is equal to the sum of y1 for each record

canopy = c(30, 42, 60, 75, 20, 25) # canopy cover (%)

df<-data.frame(richness=c(y1, y2, y3),
               canopy=rep(canopy, 3),
               type=c(rep('all plants', 6),
                      rep('grasses', 6),
                      rep('forbs',6)))

m1<-glm(y1 ~ canopy, family = 'poisson')
m2<-glm(y2 ~ canopy, family = 'poisson')
m3<-glm(y3 ~ canopy, family = 'poisson')

summary(m1)
summary(m2)
summary(m3)

library(ggplot2)

ggplot(df, aes(x= canopy, y=richness, color=type, linetype = type)) +
  geom_point(aes(shape = type)) +
  scale_shape_manual(values = c(1,2,0)) +
  geom_smooth(method = "glm", method.args = list(family = "poisson"), size=.5) +
  xlab("canopy cover %") +
  ylab("richness") +
  theme_classic() +
  theme(legend.title=element_blank())

library(stargazer)
stargazer(m1,m2,m3, type = 'text')
===============================================
                       Dependent variable:
                  -----------------------------
                      y1        y2       y3
                     (m1)      (m2)     (m3)
-----------------------------------------------
canopy            0.021***  0.029***    0.006
                   (0.005)   (0.006)   (0.008)

===============================================
Note:               *p<0.1; **p<0.05; ***p<0.01

