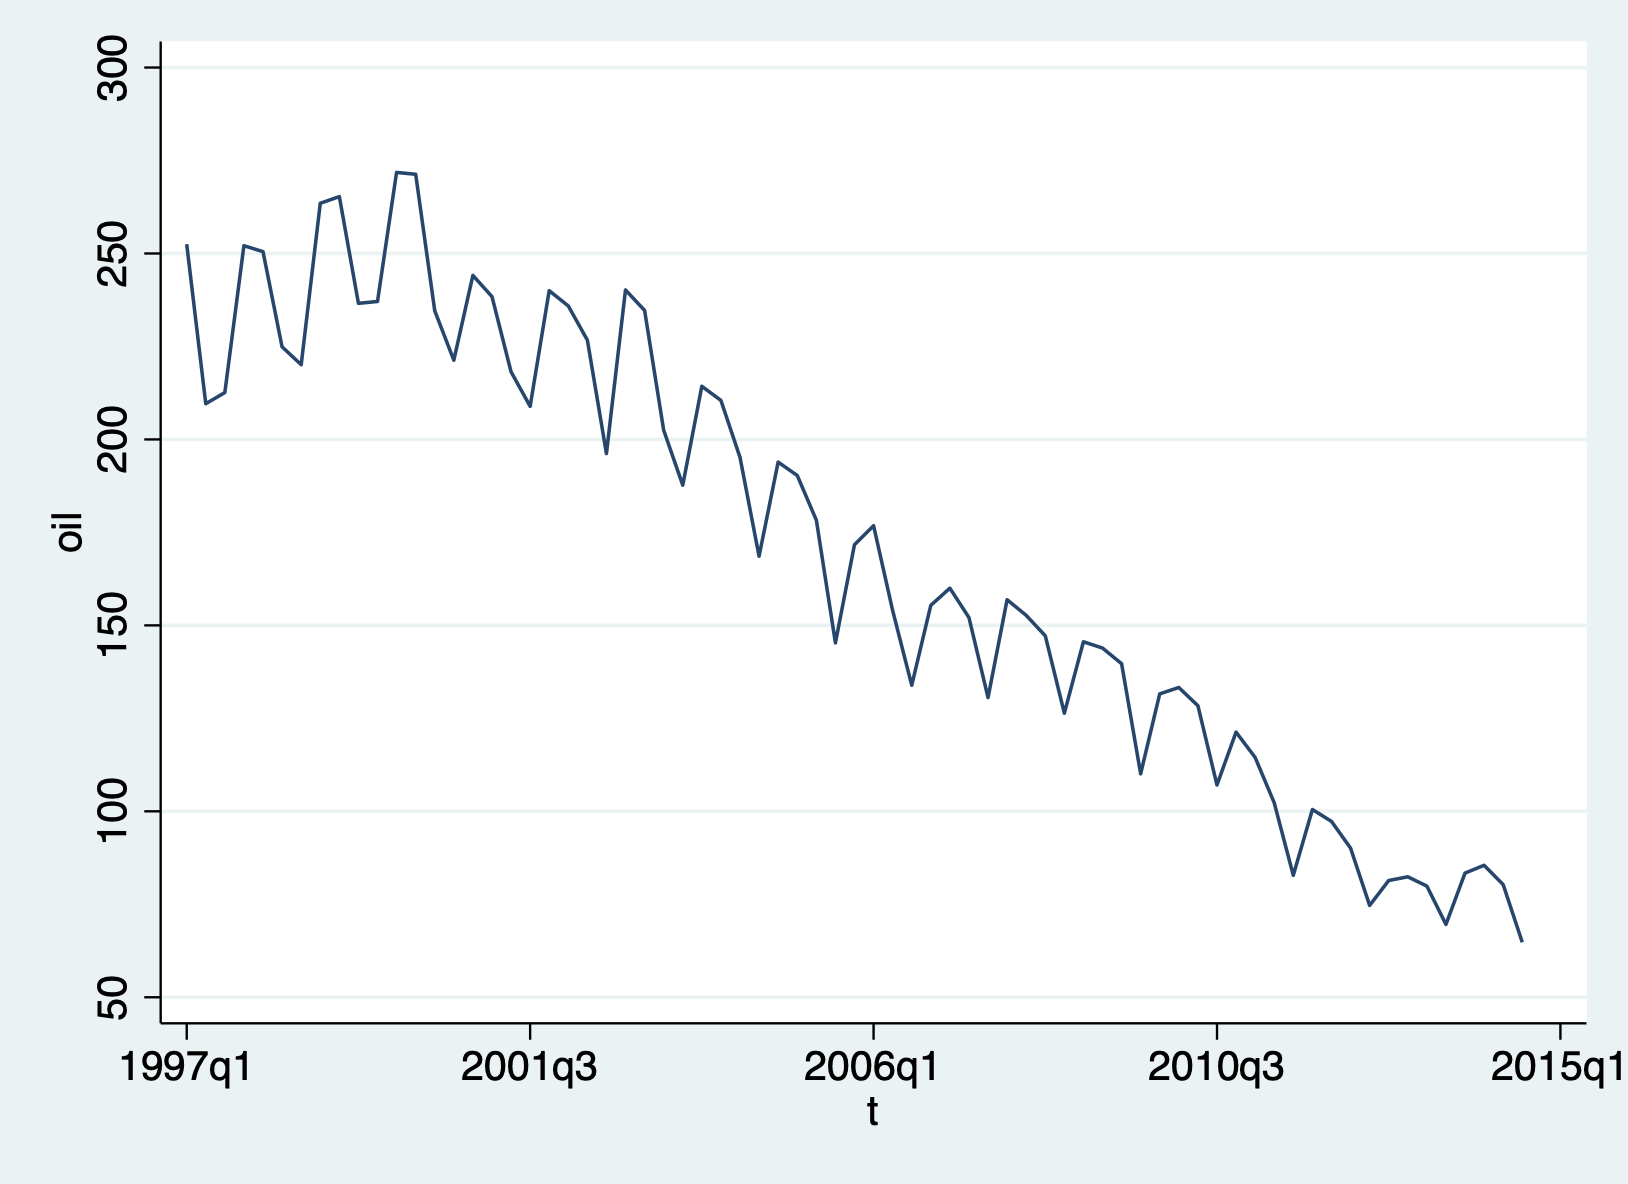
I was given an oil time series dataset (quarterly). I was trying to build an ARIMA Model in Stata. There is trend and seasonality in the data
I am trying to plot acf and pacf plot to determine the order of AR and MA process
I had already taken the log and differenced the data to remove the trend and seasonality and to make the data stationary.
So oil became log_oil and then D.log_oil
The following is the oil data plotted against time
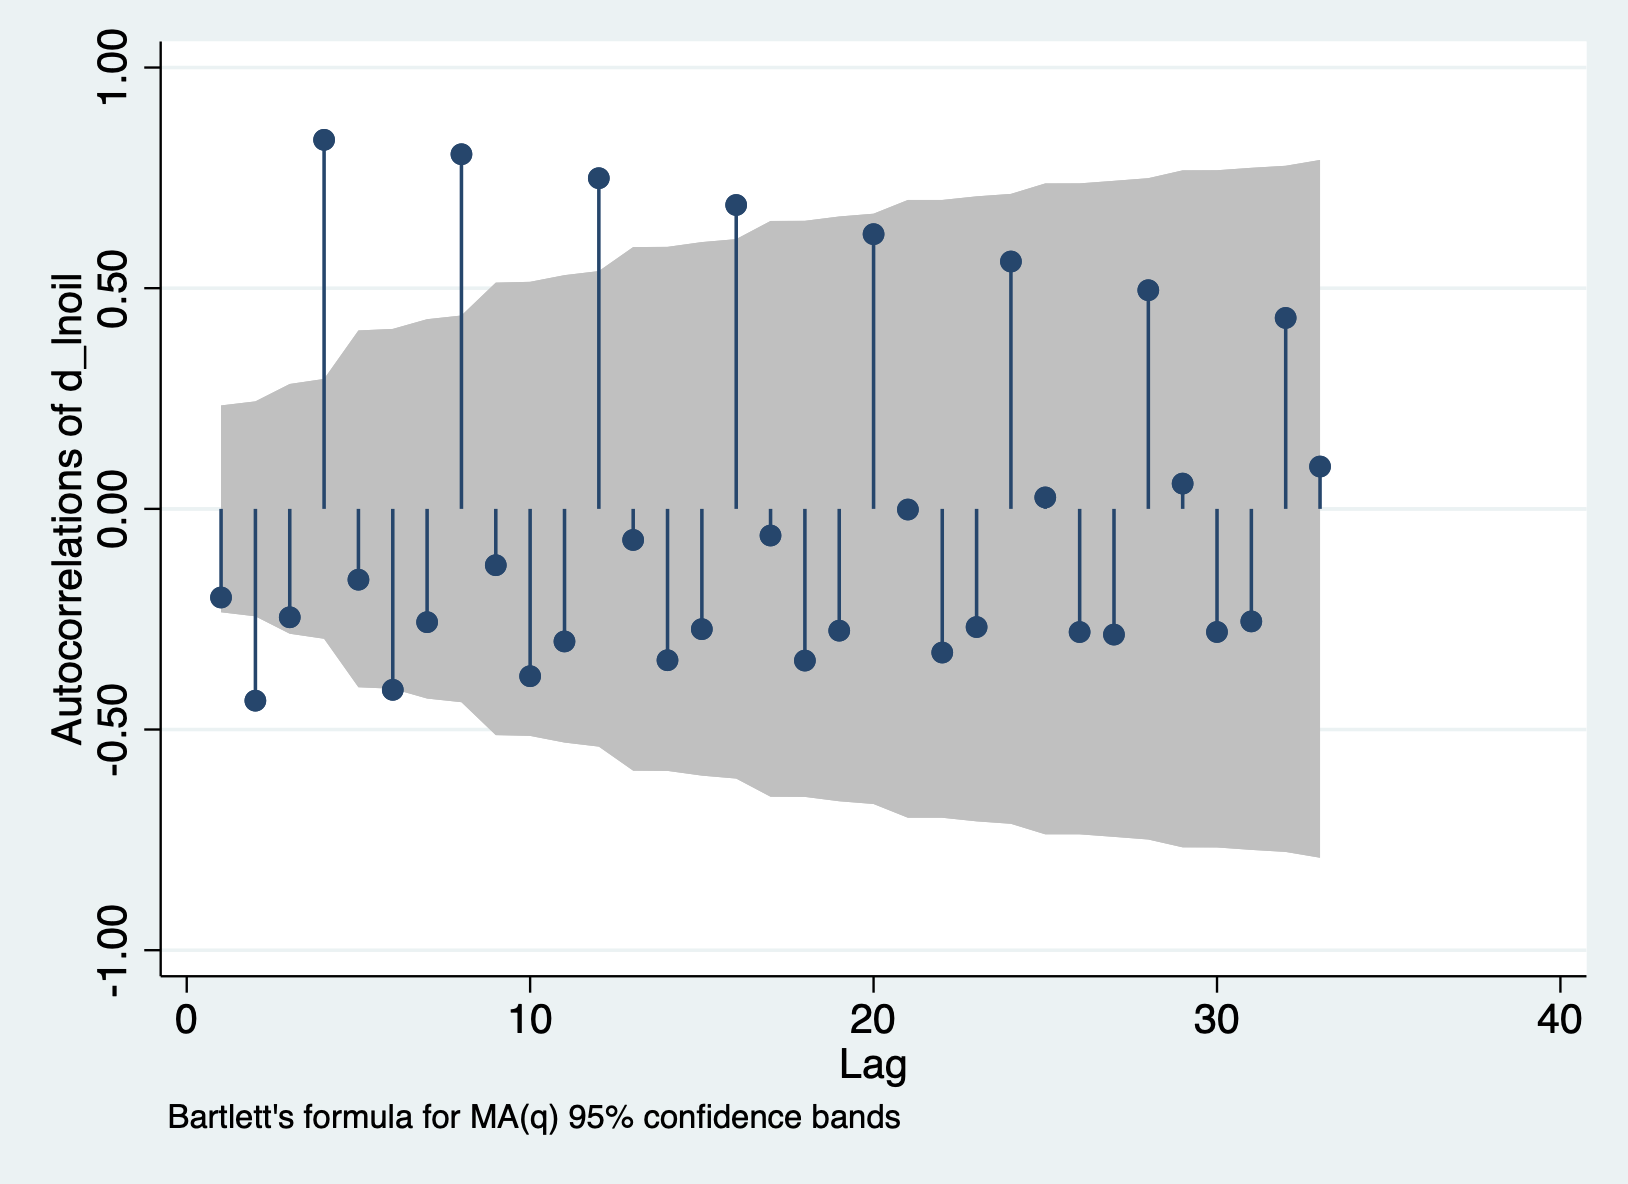
The following is the ACF plot of D.log_oil
There is still a decaying pattern in the ACF plot even after differencing and taking log. Differencing a second time still retains a similar pattern.


