0
$\begingroup$

I found an outlier using the outlierTest function in the car package. However, I can see from the results that the Externally Studentized Residual and p-values. This is a result for the full model.

    rstudent unadjusted p-value Bonferroni p
348 5.872682         7.9377e-09   3.9689e-06

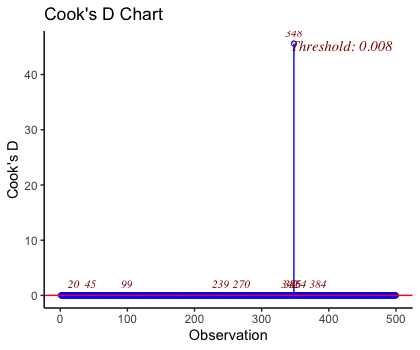
Cooks D Bar Plot:

enter image description here

I have performed normality test on residuals using the following code:

shapiro.test(resid(housing.lm)) 

R Console:

Shapiro-Wilk normality test

data:  resid(housing.lm)
W = 0.97068, p-value = 1.876e-08

The p-value is less than 0.05 indicating that the residuals may not be normally distributed. However, I assume it is not critical for linear regression as long as the other assumptions are met.

I have also performed heteroscedasticity test using the following code:

ncvTest(housing.lm)

R console:

Non-constant Variance Score Test 
Variance formula: ~ fitted.values 
Chisquare = 0.3243994, Df = 1, p = 0.56898

When I fit the regression using the coded:

lm(price~ bath + sqft, data=data)

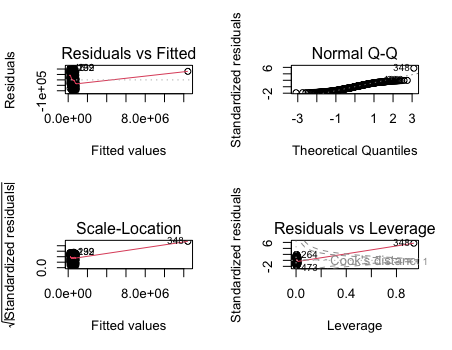
My diagnostic plots looks as follows;

enter image description here

When try to remove observation 348 based on the p-value sqft variable becomes insignificant. Is it better to keep it since it seems an influential point?

$\endgroup$
3
  • $\begingroup$ Well, at least it's telling you that that one data point has a big influence on your conclusions. $\endgroup$ Commented Mar 21, 2023 at 18:14
  • $\begingroup$ @SalMangiafico yeah but how I can I figure out if it is in a good or bad way? :) $\endgroup$
    – Dome
    Commented Mar 21, 2023 at 23:38
  • $\begingroup$ Thank you for adding the residual plots. $\endgroup$ Commented Mar 22, 2023 at 14:17

1 Answer 1

0
$\begingroup$

In general, you shouldn't remove outliers unless you know that the data point is wrong or impossible or otherwise objectionable in reality.

Using methods to detect outliers is useful to find data that may require some double-checking or additional scrutiny.

However, in this case, that one data point appears to be so far out from the rest of the data set (with n > 300).

One approach is to use a robust method that won't be as affected by this one point.

In this case, your model is simple enough that I'm sure you can see what effect that one point has on the results. I mean by examining simple plots of the dependent variable vs. each independent variable.

I can't make a conclusion without seeing all the data, and understanding what it is that you are trying to model (and why !). But I think if your conclusion is that this one point should be removed so as not to bias the results (in the colloquial sense), that may be a reasonable approach. One large, expensive house in the data set may influence the results to suggest that sqft has a large effect on price, when it doesn't for the rest of the 300 + data points.

If you choose to remove this point, be sure to state this in your results and explain why. It may simply be that you remove the one observation with sqft > X because it's not representative of the rest of the rest of the population.

$\endgroup$

Your Answer

By clicking “Post Your Answer”, you agree to our terms of service and acknowledge you have read our privacy policy.

Not the answer you're looking for? Browse other questions tagged or ask your own question.