1
$\begingroup$

I have tried to follow the steps indicated on this page and it doesn't work as it doesn't identify the function "recipe" (which I fail to understand anyways...). I am trying to find the best Box-Cox transformation to stationaries in variance my time series.

https://recipes.tidymodels.org/reference/step_BoxCox.html

Here is my code :

 rec <- recipe(~., data = as.data.frame(prod))
 bc_trans <- step_BoxCox(rec, all_numeric())
 bc_estimates <- prep(bc_trans, training = as.data.frame(prod))
 bc_data <- bake(bc_estimates, as.data.frame(prod))
 plot(density(prod[, "Production"]), main = "before")

And here is the structure of my dataset for reproducibility :

   structure(list(date = c("2022-11", "2022-10", "2022-09", "2022-08", 
                          "2022-07", "2022-06"), production_brute_nucleaire = 
  c(22951.429, 
                                                                           
   21465.026, 19334.531, 19319.365, 19923.664, 21275.248)), row.names = c(NA, 
                                                                                                                                             
   6L), class = "data.frame")
$\endgroup$

1 Answer 1

2
$\begingroup$

Running your code with minor fixes

product <- structure(list(date = c("2022-11", "2022-10", "2022-09", "2022-08", "2022-07", "2022-06"), 
                          production_brute_nucleaire = c(22951.429, 21465.026, 19334.531, 19319.365, 19923.664, 21275.248)), 
                         row.names = c(NA, 6L), 
                         class = "data.frame")
> str(product)
'data.frame':   6 obs. of  2 variables:
 $ date                      : chr  "2022-11" "2022-10" "2022-09" "2022-08" ...
 $ production_brute_nucleaire: num  22951 21465 19335 19319 19924 ...


library(recipes)
rec <- recipe(~., data = product)
bc_trans <- step_BoxCox(rec, all_numeric())

> bc_estimates <- prep(bc_trans, training = product)
Warning message:
In optimize(bc_obj, interval = limits, maximum = TRUE, dat = dat,  :
  NA/Inf replaced by maximum positive value

bc_data <- bake(bc_estimates, product)
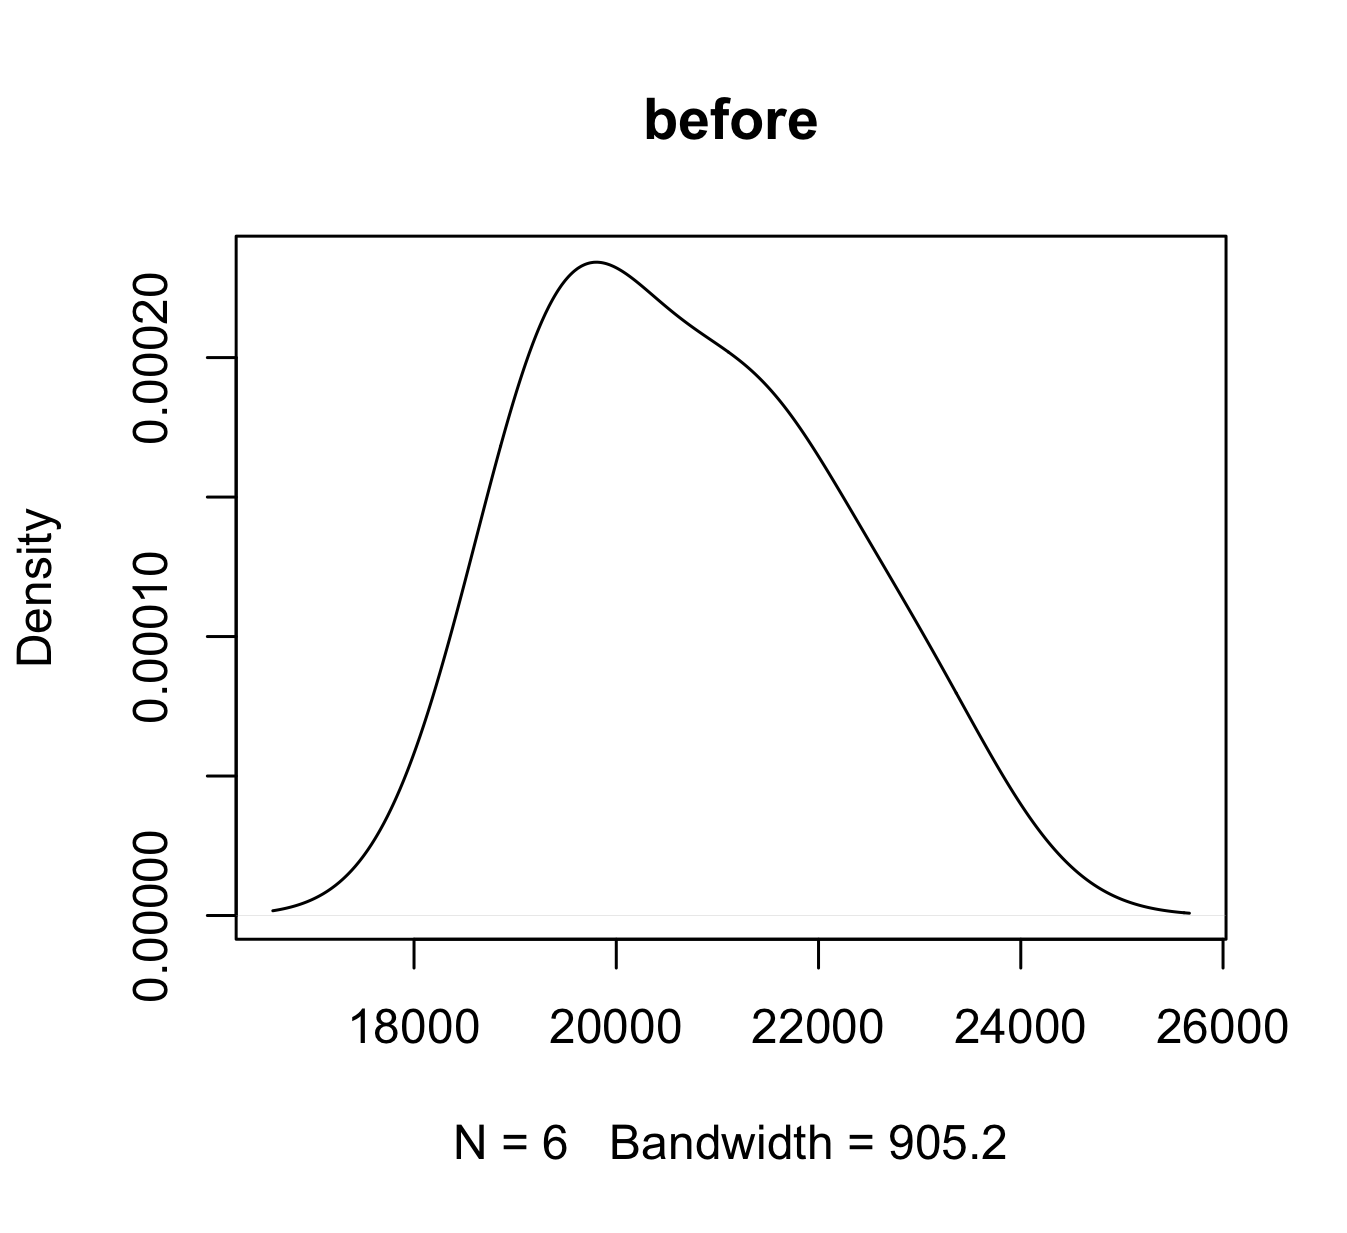
plot(density(product$production_brute_nucleaire), main = "before")

gives this

enter image description here

Remark 1 You have to be careful when applying the Box-Cox transformation to a time-series variable though. The derivation of the likelihood function in the Box-Cox transformation (G.E.P. Box and D.R. Cox, An Analysis of Transformations, Journal of the Royal Statistical Society. Series B (Methodological), Vol. 26, No. 2 (1964), pp. 211-252) presumes independent observations, an assumption which may not be met in a time-series context.

$\endgroup$

Your Answer

By clicking “Post Your Answer”, you agree to our terms of service and acknowledge you have read our privacy policy.

Not the answer you're looking for? Browse other questions tagged or ask your own question.