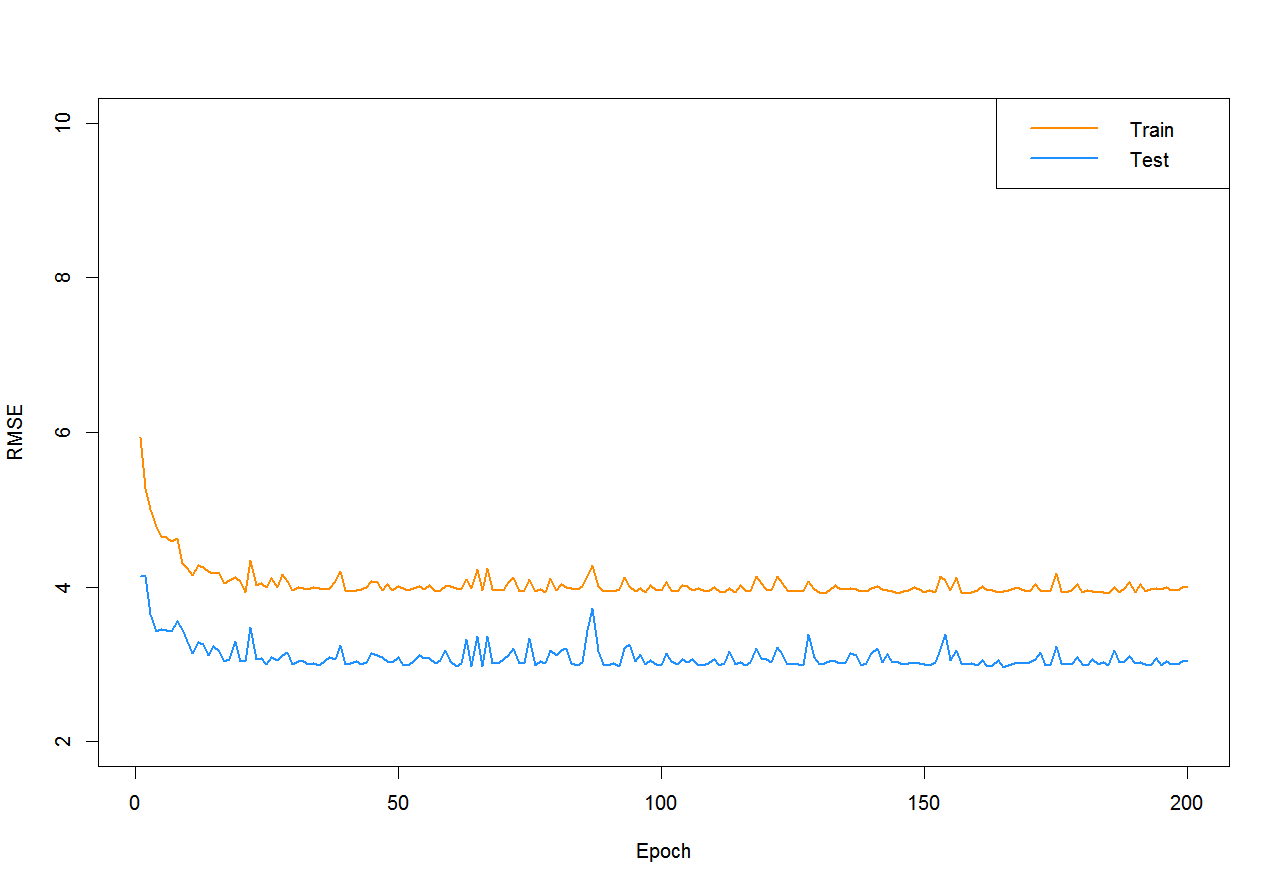
I have been trying to use the LSTM model for a monthly time series with a length of 404 (384 for training and 20 for test). I created 4 pairs of training/validation sets, trained different models, and chose the model that performed the best on the validation sets. The selected model was constructed on the training set to forecast the test set. I am trying to determine whether my model is overfitting. I have shared a plot of the training and test loss:
 Could someone help me to understand whether this plot illustrates signs of overfitting?
1 Answer
If your labels are correct, this plot is actually not indicative of overfitting your training set. This is because your training RMSE is higher than your testing RMSE. It is when testing error is much higher than training error that you may be overfitting your training dataset.
I would make sure to double-check that you don't have a coding error that has caused your plot to look like this as it is good to be suspicious of a testing error that is much lower than training.
-
$\begingroup$ I appreciate your answer to my question. The labels are correct. I'm wondering if the proportion of the training set and test set could have caused the higher training RMSE. I changed the size of the test set from 20 observations to 80, and now the test RMSE is higher than the training RMSE. This i.sstatic.net/GlUh7.png shows the new result. Does it show any signs of overfitting? I can also share the diagram of splitting monthly data i.sstatic.net/F4MqL.png. $\endgroup$ Commented Sep 10, 2023 at 11:02
