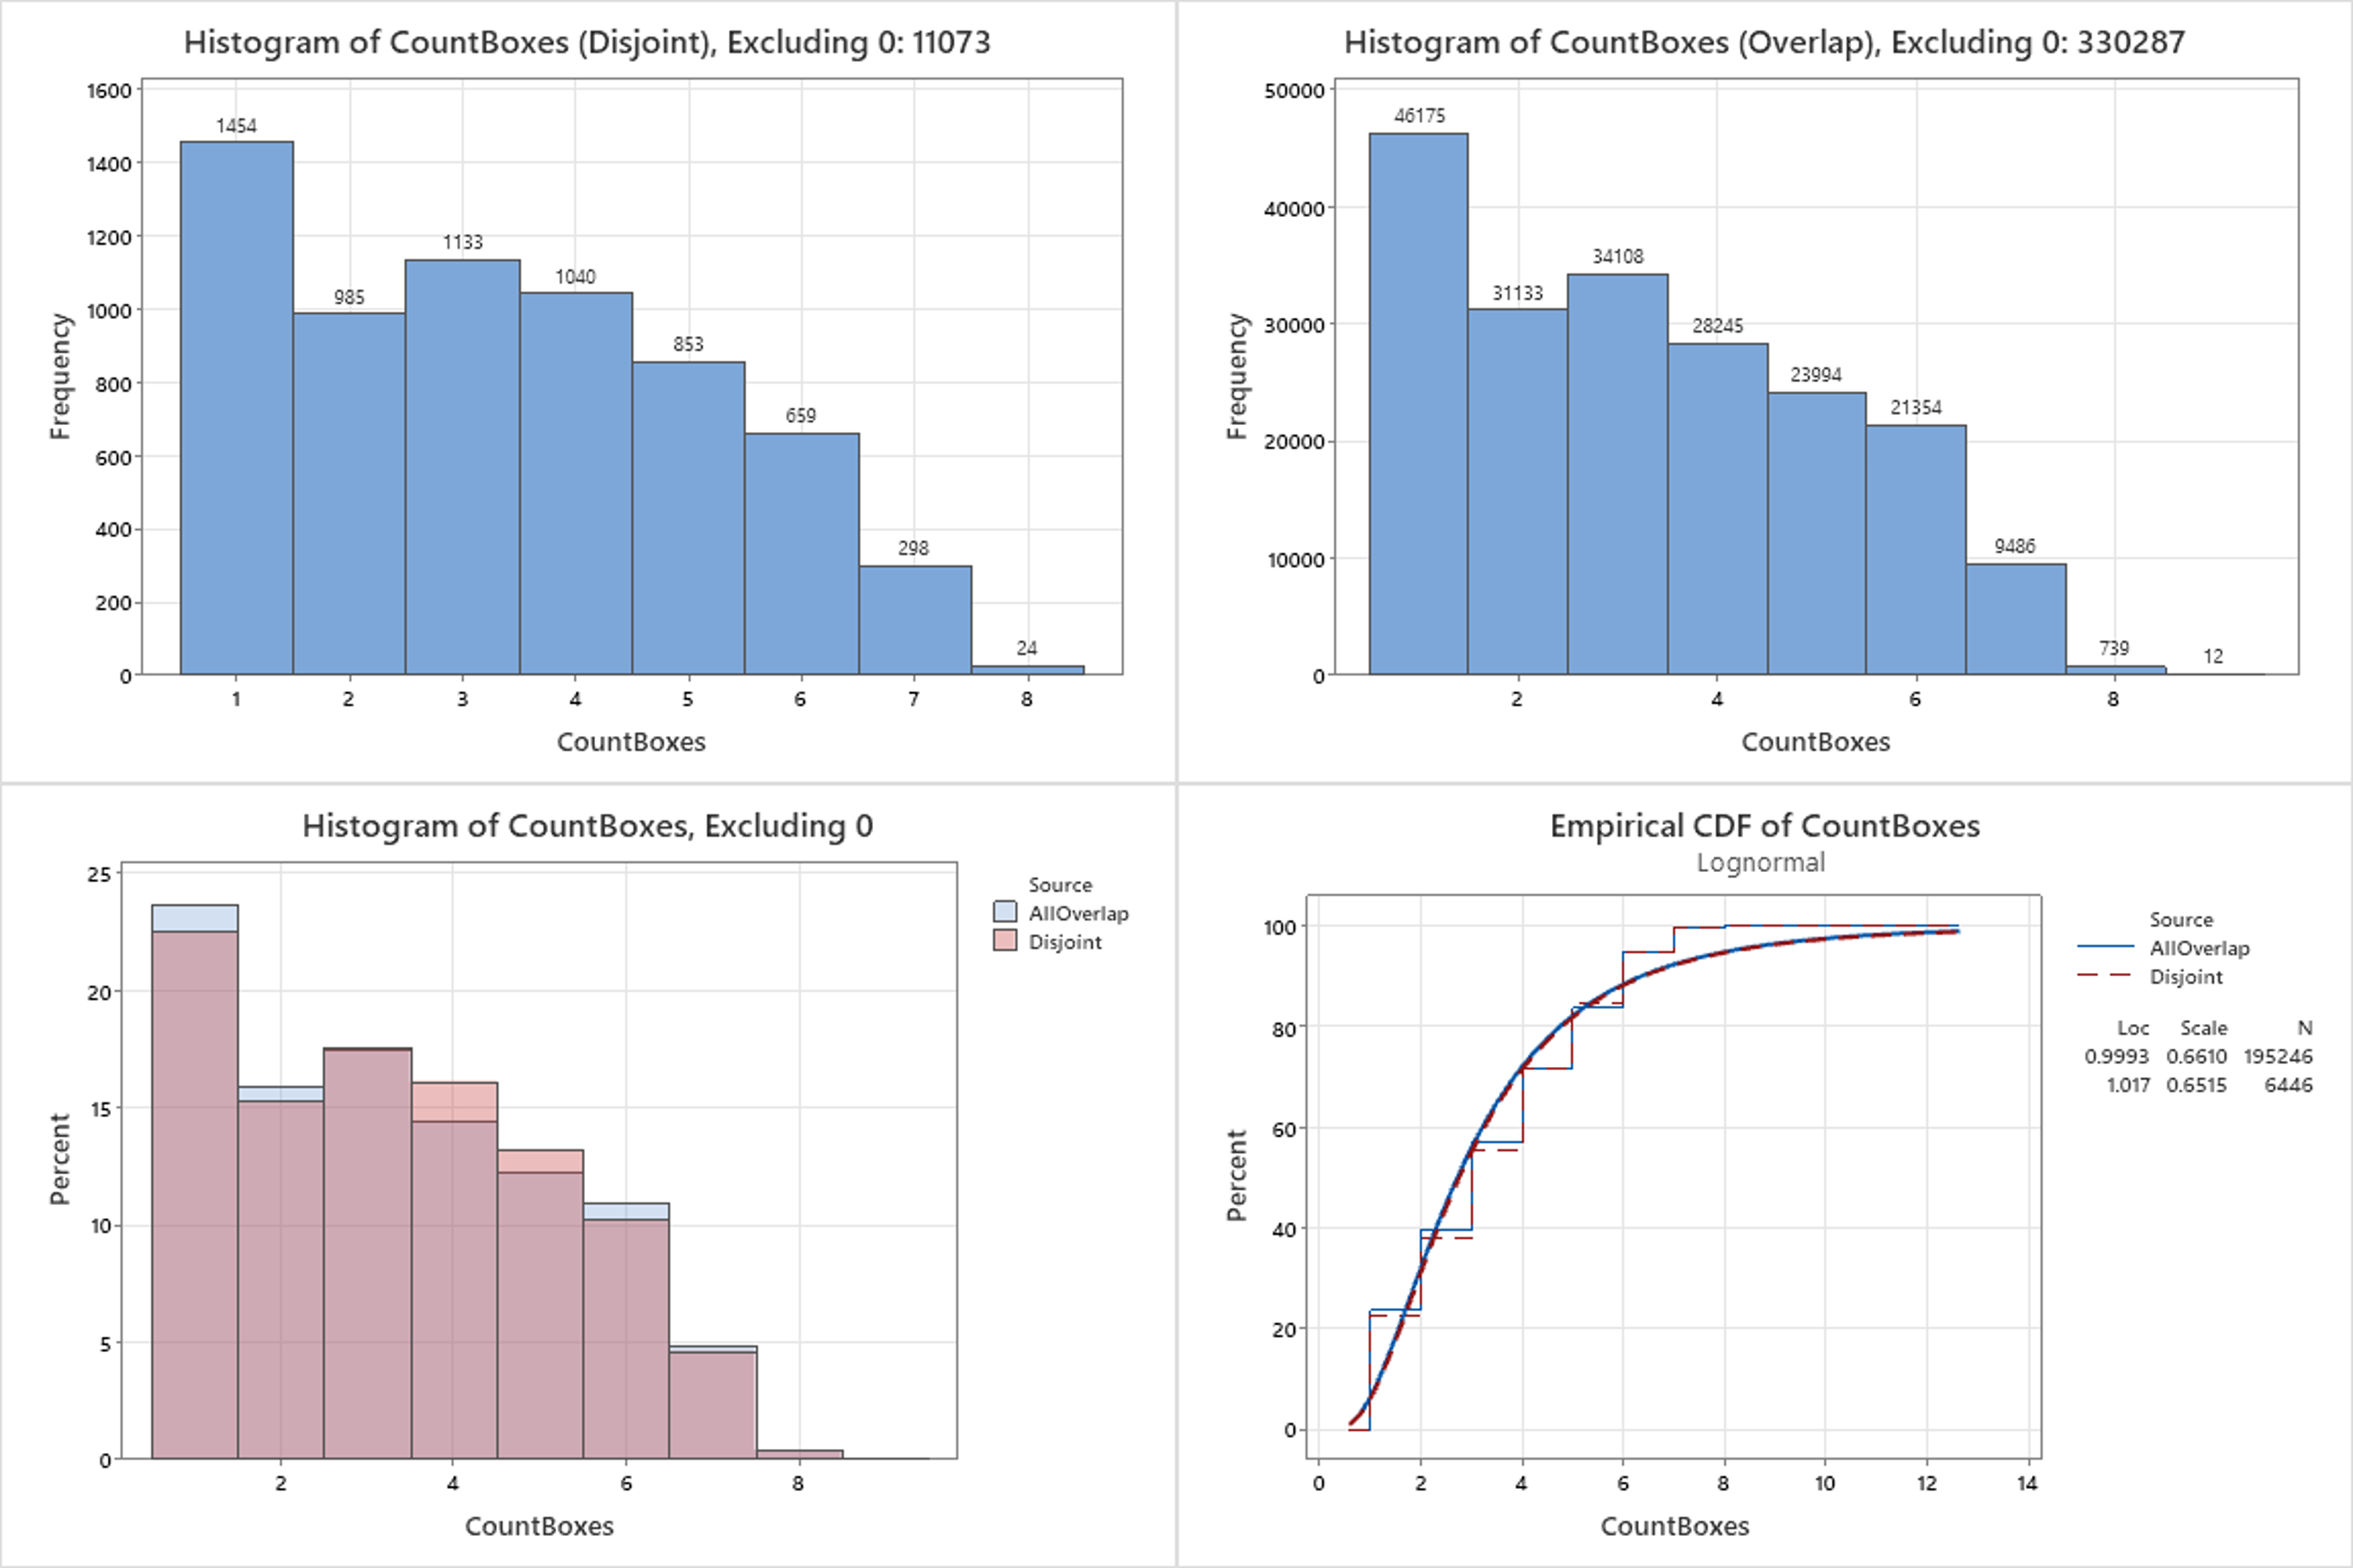
I have about a year's worth of timestamps at which boxes exit a manufacturing production line. ti are the timestamps, where the first timestamp is t1, second timestamp is t2, etc. These can be anywhere from a few minutes apart to many hours apart. I would like to analyze the probability distribution for the number of boxes that exit the line in a 30-minute time interval (in order to make a simulation model for the boxes exiting the line). This sounds like a Poisson process.
I see 2 ways to extract the frequencies of box counts.
- "Disjoint" windows. The first window is [t1, t1 + 30 minutes). Second window is [t1 + 30 minutes, t1 + 60 minutes). And so on. i.e. each window is 30 minutes long and is shifting by 30 minutes each time.
- "Overlapping" windows. The first window is [t1, t1 + 30 minutes). Second window is [t1 + 1 minute, t1 + 31 minutes). And so on. i.e. each window is 30 minutes long and is shifting by 1 minute each time.
In both methods, count the number of boxes for each window. By the end, will have a frequency for each count.
My reasoning for Method 2 is that it covers any and all possible 30-minute windows from the historical data, whereas Method 1 is only a subset. Method 2 also has counts that are missed by Method 1 i.e. there have been a few 30-minute windows where there were 9 boxes in Method 2, but not in Method 1. I'm not sure which method is correct/typical for obtaining frequencies for a Poisson process. After analyzing the histograms and CDF plots (shown below), they seem similar...
However, regardless of which window method I use, it doesn't seem that the data (boxes exiting timestamps) satisfies assumption(s) for a Poisson process in the first place. Although the boxes themselves are independent of one another and only one box exits at a time, the number of boxes in a 30-minute interval depends on multiple factors e.g. demand, when production is scheduled, the quantity scheduled (and quantity produced so far), the container type scheduled (some containers hold over 100 parts, so only 1 box exits in 30 minutes, whereas some hold less than 20 parts, so multiple boxes can exit in 30 minutes). There are also many periods without production, so the data is zero-inflated. Thus, the probability of X boxes within any 30-minute interval is likely not the same. The "Poisson Goodness of Fit Test" in Minitab fails as well (rejects null hypothesis for Chi-Square test).
So, even if it isn't Poisson, I could still use the empirical distribution (CDF). But this feels wrong, as it does not account for the factors mentioned above. Should I be doing some kind of conditional probability based on scheduling patterns (i.e. when production is scheduled and quantity/containers scheduled)? If so, how can I look at the probability of scheduling patterns based on these timestamps alone? One thought was to use Markov chains (e.g. probability of going from X1 boxes having N1 total parts in one 30-minute interval to X2 boxes having N2 total parts in the next 30-minute interval)... I'm not really sure what I'm doing / how to proceed.

