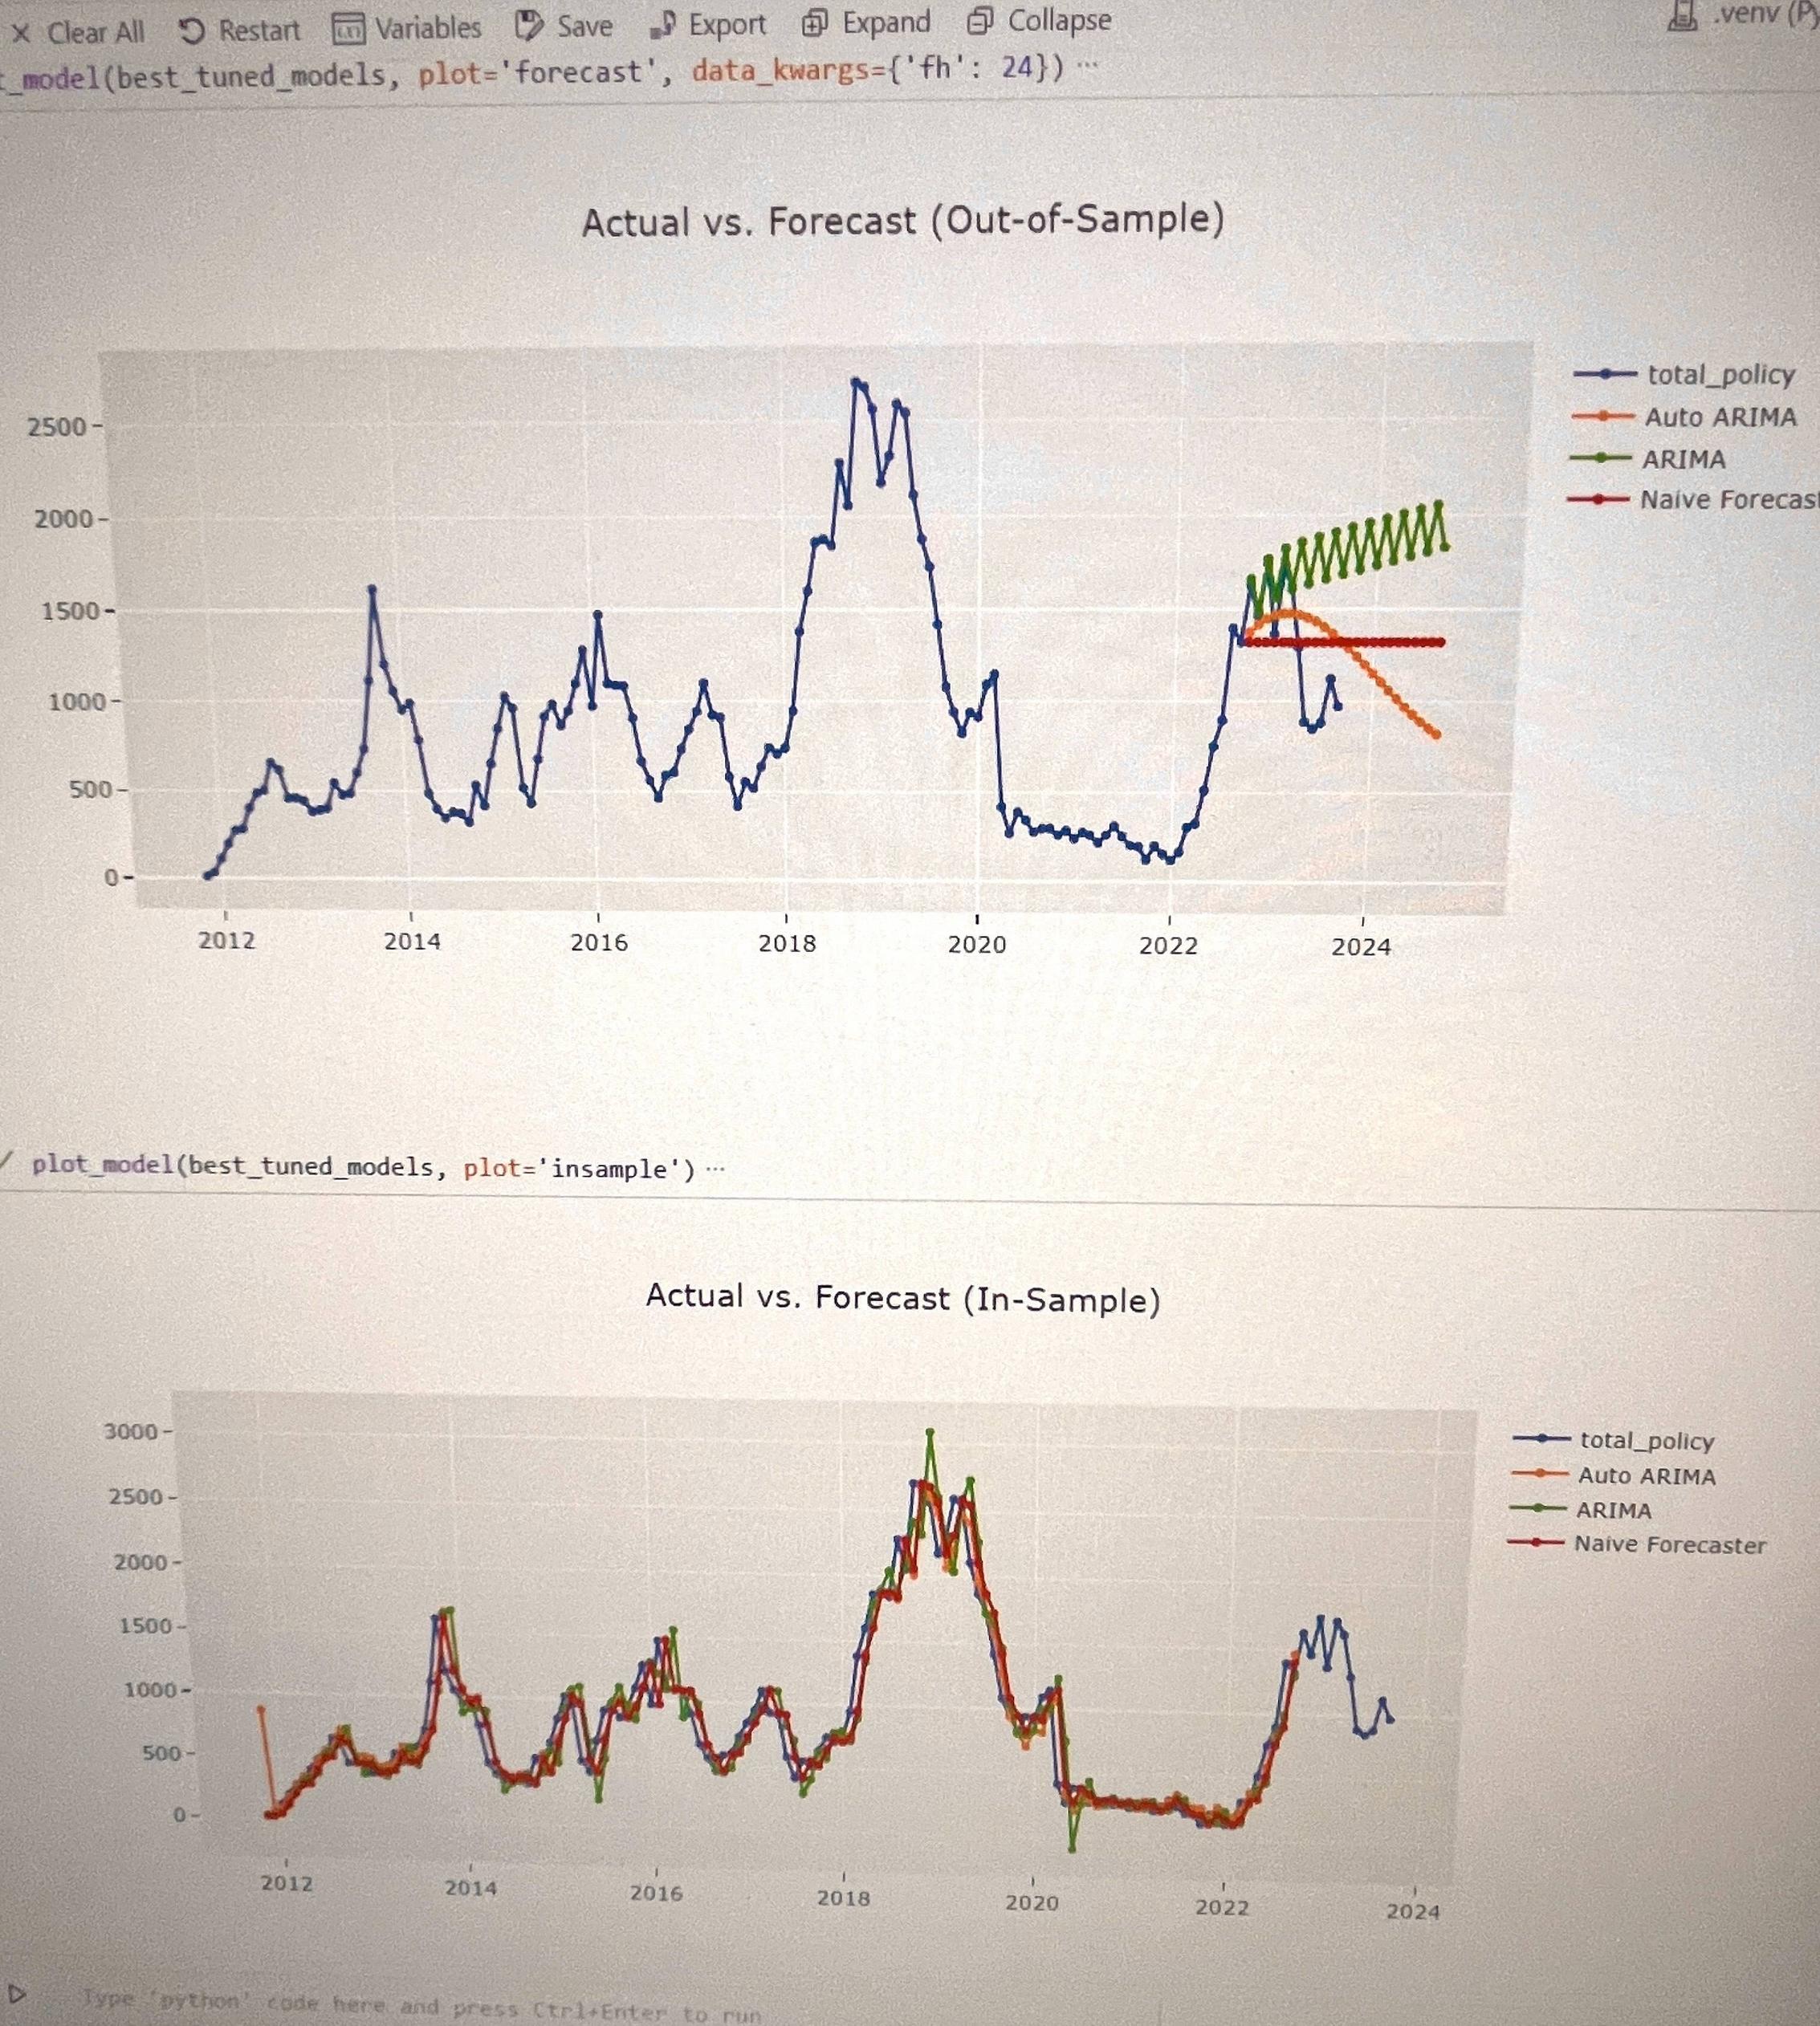
why the in-sample looks very different from the out-of-sample? Is the in-sample overfitting? Horizon is 12, using pycaret time series function.
1 Answer
This is a common issue in forecasting. It appears pycaret is using a simple random walk modelas the naive, where the prediction for each point is equal to the actual from the previous point. With other models, the issue is close to being the same thing, so it's worth going into the random walk model in depth.
For in-sample, random walk models will have the last actual value, and it will use it for the prediction.
For out-of-sample, the actuals are not available. Random walk will use the last actual to predict the next point. For subsequent points, an immediately previous actual is not available, so it will use the predicted from previous points. This means the last in-sample point will be the prediction for the entire out-of-sample set.
-
$\begingroup$ Thanks! How about the two ARIMA? My understanding is that in the in-sample, they are overfitting, and for out-of-sample, the next 12 month forecasting are just some results of ARIMA with some seasonality components. How the two ARIMA can be so good in fitting the in-sample though? Lol. $\endgroup$ Commented Sep 27, 2023 at 18:52
-
1$\begingroup$ Again, it’s because it can correct for each previous actual for the in sample. For the out of sample, it just has to fly blind. $\endgroup$– PaulCommented Sep 27, 2023 at 22:14

