1
$\begingroup$

I am struggling with a time series dataset comprising 12 features, including quantity sold and weather data, totaling approximately 1800 values, where data is recorded on a daily basis. My goal has been to forecast future values, quantity sold, for the next 7 days for a specific item. Despite exploring various avenues, I have not yet identified an optimal model for accurate predictions. Here's a summary of my attempts:

  1. ARIMA Model: I began with the ARIMA model, experimenting with different combinations of parameters (p, d, and q) during training. However, my R-squared values for test data never exceeded 0.45. Even visual inspection revealed that the model did not fit the test data well.

    model = SARIMAX(df_train[item],order=(5,1,0),seasonal_order=(1,1,1,60), enforce_stationarity=False, enforce_invertibility=False)

ADF Statistic: -3.7660612647232545
p-value: 0.0032742778913118914
Lags Used: 23
Number of Observations Used: 1800

Critical Values:
   1%: -3.4339881389288407
   5%: -2.863147035877915
   10%: -2.567625533641975
Reject the null hypothesis (H0). The data is stationary.

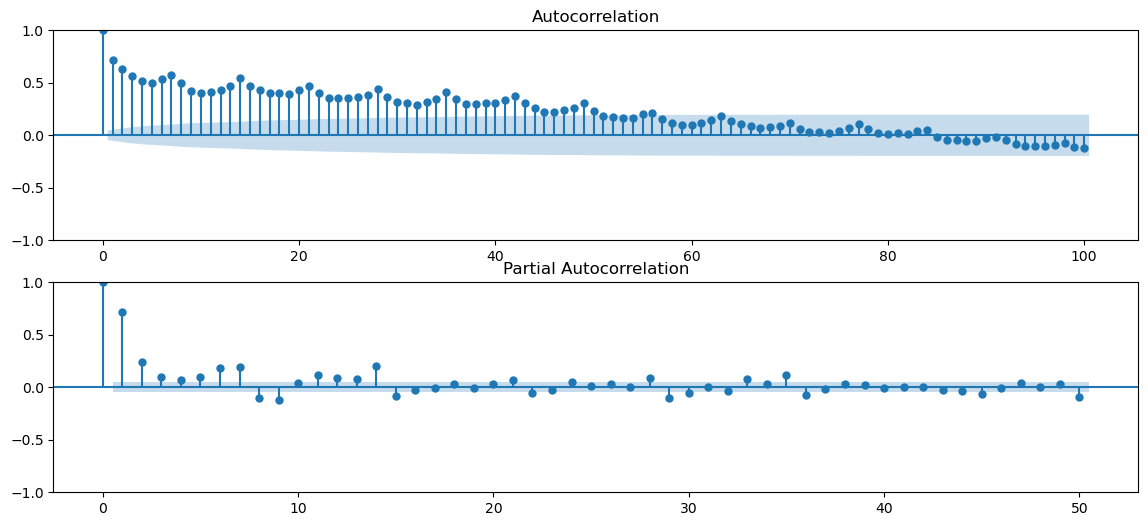
Here are some plot:

enter image description here enter image description here

  1. Machine Learning Models: I also delved into machine learning techniques, including XGBoost, Random Forest, and others. Despite my efforts, I couldn't achieve R-squared values higher than 60%.
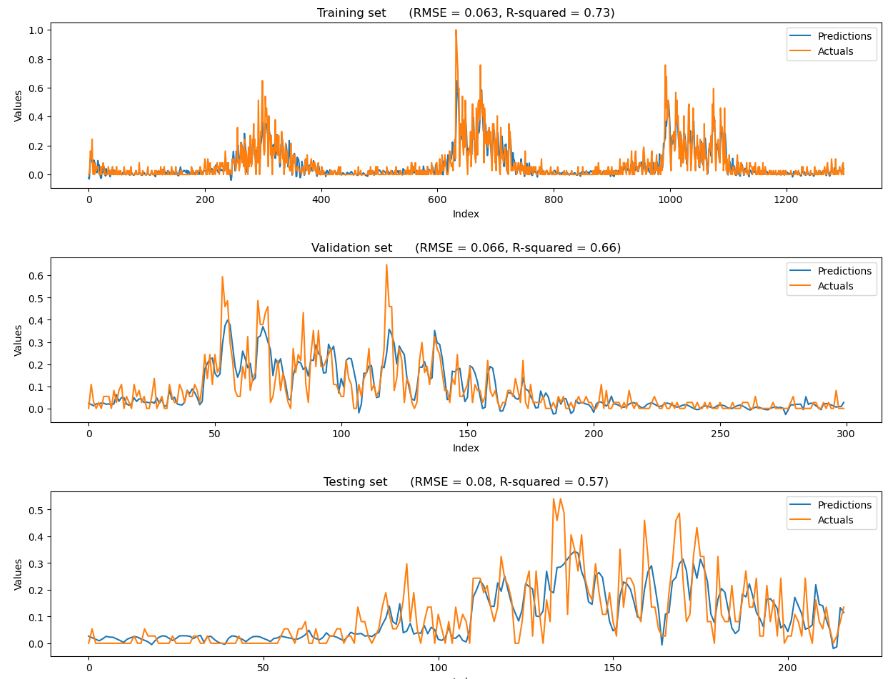
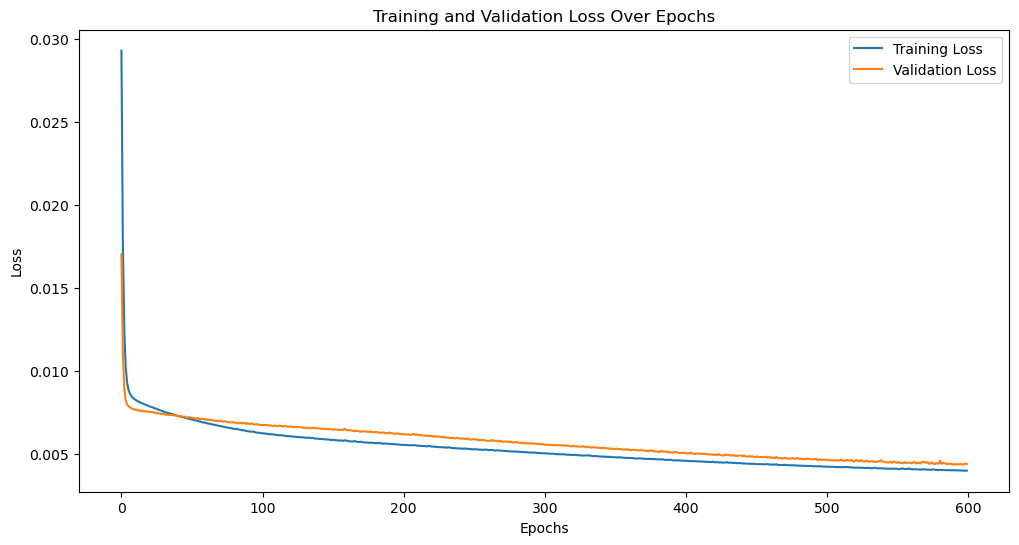
  2. LSTM (Long Short-Term Memory): In addition, I explored the LSTM model, a type of recurrent neural network commonly used for time series forecasting. Unfortunately, this approach did not yield satisfactory results either. I will provide some plots related to the LSTM model, which will offer deeper insights into the dataset. These visualizations will aid in understanding the structure of the target variable and other essential properties.

I've implemented the model with a learning rate of 1E-5. I experimented with higher rates, but this particular value has yielded the most promising results thus far. Additionally, I fine-tuned the hyperparameters using GridSearch and KerasRegressor to optimize the model's performance.

model = Sequential()
model.add(InputLayer((7, temp_df.shape[1])))
model.add(LSTM(128))
model.add(Dense(8, 'relu'))
model.add(Dense(1, 'linear'))

model.compile(loss=MeanSquaredError(), optimizer=Adam(learning_rate=1E-5), metrics=[RootMeanSquaredError()])
early_stopping = EarlyStopping(monitor='val_loss', patience=10, restore_best_weights=True)
model.fit(X2_train, y2_train, epochs=5000, batch_size=32, 
                     validation_data=(X2_val, y2_val), callbacks=[early_stopping], verbose=1)

Please note that I applied normalized data, MinMaxScaler(), and incorporated time-dependent features extracted from the date in all the models. I extensively tested various combinations, yet none of them yielded superior results. Despite these challenges, I am continuing my search for a suitable model that can effectively predict future values in this complex dataset.

I believe there are crucial aspects I might be overlooking while trying to solve this model. I would be grateful if you could point out specific areas or provide insights that could help me address these challenges effectively. Your guidance would be greatly appreciated.

enter image description here enter image description here

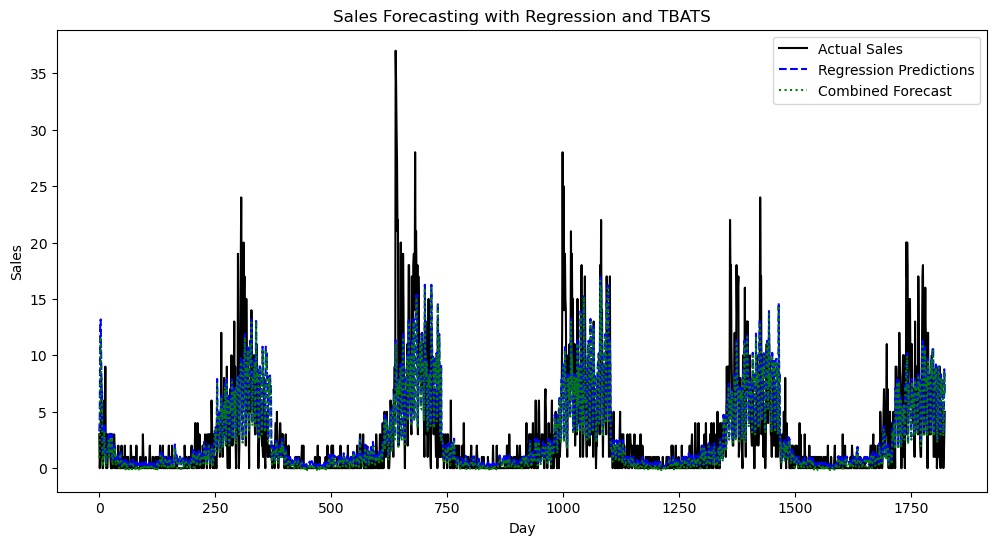
  1. EDITED version with poisson regressor. I see there is some improvement compare to previous model using LinearRegressor.
poisson_model = sm.GLM(y, X, family=sm.families.Poisson())
tbats_model = TBATS(seasonal_periods=(7, 365.25))
r2 Score (Regression): 0.5563435836305534
RMSE (Regression): 2.9807373184768573
r2 Score (Combined Forecast): 0.5547685856536695
RMSE (Combined Forecast): 2.9860234992906065

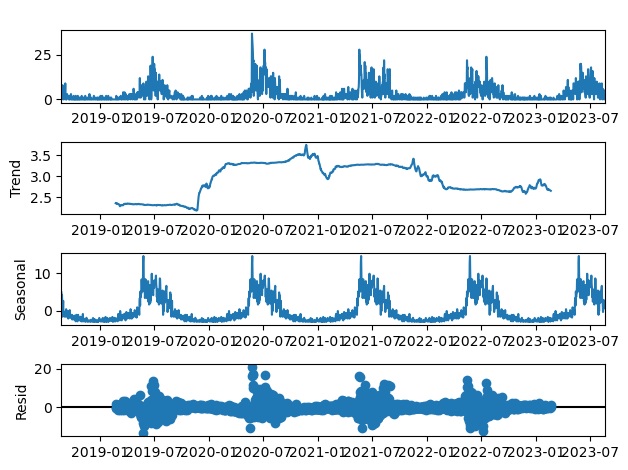
enter image description here

$\endgroup$
1
  • 1
    $\begingroup$ Is your data daily? $\endgroup$ Commented Oct 30, 2023 at 16:52

1 Answer 1

0
$\begingroup$
  1. Your plots clearly show yearly seasonality. A seasonal frequency of 60 for daily data will not capture that, and ARIMA has major issues with "long" seasonality.

  2. Daily data typically exhibits . The tag wiki contains pointers to literature for such effects. Previous threads in this tag may be helpful. For your ML tools, I would recommend you include dummy predictors for day of week, and harmonic transforms for day of year.

  3. You discuss weather. Note that in production, you will not know tomorrow's weather, only the weather forecast. So even if the weather carries information beyond seasonality, if you use the actual weather in the forecast period, you will be overestimating the quality of your forecasts.

  4. ML methods like LSTM work better if you have "many" related time series. They usually do not yield a major benefit over "classical" methods if you have a single or few time series.

  5. In-sample fit via $R^2$ is notoriously unreliable as a guide to out-of-sample forecast accuracy. The gold standard in forecast evaluation is using a holdout sample.

  6. There is a limit to forecastability. You typically reach it earlier than you think, and earlier than you would like.

  7. We have a canonical thread on resources for forecasting, which may be useful for you: Resources/books for project on forecasting models

$\endgroup$
10
  • $\begingroup$ "@Stephan Kolassa": You are correct that we observe a yearly seasonality here. However, using ARIMA over a longer period is challenging. That's why I was experimenting with different season lengths, such as 60. Additionally, I don't have enough data to use with LSTM, and I believe this might be the reason for the less accurate predictions. If you can point out the best strategy to solve this problem, it would be great. In the meantime, I will go through the rest of your above comments. $\endgroup$
    – BasicTex
    Commented Oct 30, 2023 at 17:57
  • $\begingroup$ Do take a look at the multiple seasonalities tag wiki, there actually is a lot of information in there. (Having put most of it in, I may be biased in thinking that it's actually good information.) Something like a Random Forest with predictors like I outlined may make the most sense. Linear Regression may work, possibly if you include interaction terms between the weekday dummies and the day-of-year harmonics (since your weekday pattern probably interacts with day of year). $\endgroup$ Commented Oct 30, 2023 at 18:05
  • $\begingroup$ I have tried various machine learning algorithms including Random Forest, Gradient Boosting, XGBoost, SVM and Logestic Regression. I have also experimented with using only sales data and also including combination of additional features like 'dayofweek', 'month', ‘dayofmonth' and 'weekofyear'. However, I have not been able to find a better model. I am kind of stuck. $\endgroup$
    – BasicTex
    Commented Oct 30, 2023 at 18:16
  • $\begingroup$ So, have you tried the methods that have been specifically developed to deal with multiple seasonalities? Perhaps regress on your other features first, then model the seasonalities using TBATS or similar? Then again, this may be useful. $\endgroup$ Commented Oct 30, 2023 at 18:34
  • $\begingroup$ Sorry, I don't understand. Could you please elaborate your comment," Perhaps regress on your other features first, then model the seasonality using TBATS". How to do this? I applied TBATS on sell data, and the predictions are far from the actual. $\endgroup$
    – BasicTex
    Commented Oct 30, 2023 at 20:27

Your Answer

By clicking “Post Your Answer”, you agree to our terms of service and acknowledge you have read our privacy policy.

Not the answer you're looking for? Browse other questions tagged or ask your own question.