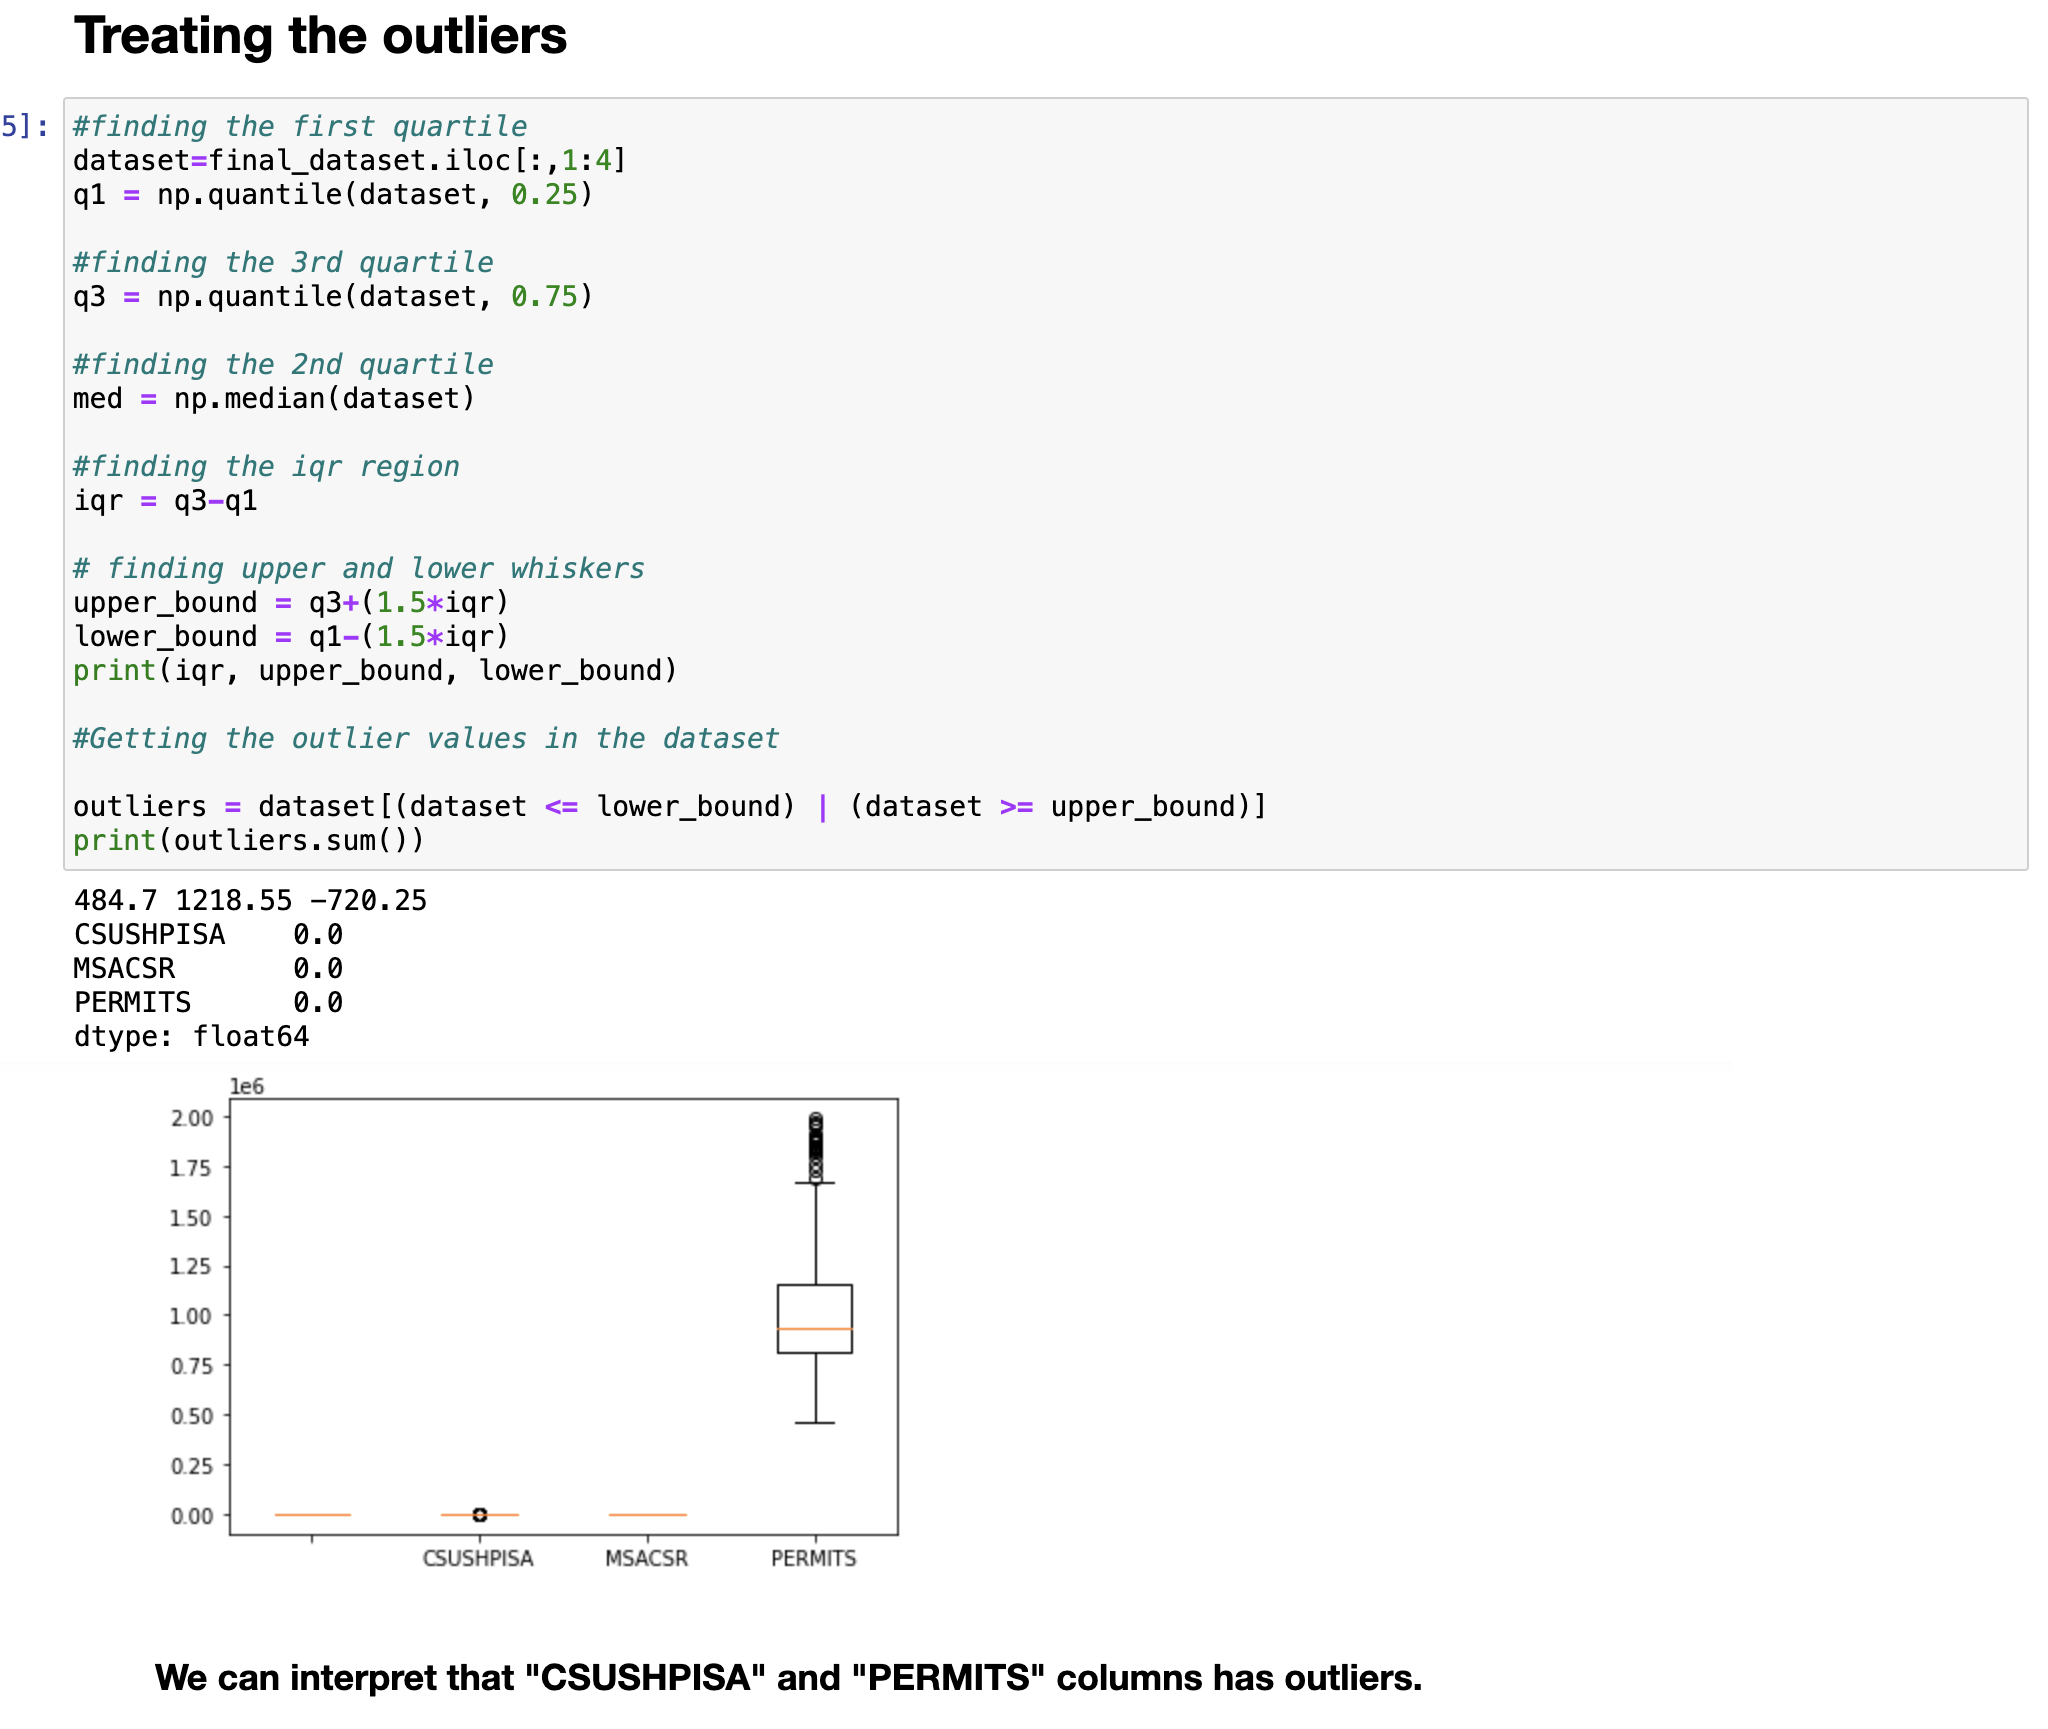
While plotting a box plot, the plot is showing the columns in the dataset has outliers, but while trying to calculate it by IQR formula, it is showing there are 0 outliers in the columns of the dataset, why is it showing this? How to find the outliers that the boxplot is showing?
$\begingroup$
$\endgroup$
1
-
$\begingroup$ I don't know Python, but it looks like your formula is operating on the whole data set, while the graph is divided by category. $\endgroup$– Peter FlomCommented Jan 20 at 14:46
Add a comment
|
