3
$\begingroup$

My understanding about likelihood, given some reading, is that it is how likely we are to observe the actual data given a certain parameter or parameter values $\theta$. Like with the coin toss analogy, say you have $p(h) = 0.5$ be the probability you get a heads and you got 3 heads in 6 tosses. Then, plotting the likelihood, you'd see that it would (naturally) be greatest at $p(h) = 0.5$ outta possible $p(h)$ values $[0, 1]$. That is 0.5 is the parameter value that makes us most likely to observe the actual data where $p(h)$ is the parameter $\theta$.

Assuming I have understood the conceptual portion correctly then that makes sense to me.

But how would we actually construct the likelihood function for the coin tosses? If we already know how many heads we have gotten (3 in 6 trials) would we not have a binomial distribution (6 bernoulli trials)? And if so how would we use that to construct a likelihood function for various values of the parameter here.

$\endgroup$
1

3 Answers 3

2
$\begingroup$

Let $X$ be a random variable, specifically a continuous random variable. If $x$ is a specific value that $X$ can output then the probability that $X = x$ actually happens with probability zero.

So it is helpful to thicken the point $x$ a little bit and consider the interval from $x - \varepsilon$ to $x + \varepsilon$. Now we can calculate the probability that $X$ falls within this interval and get a non-zero answer.

To get the the likelihood of $X$ at $x$ we shrink $\varepsilon$ down to zero while dividing by the length of the interval ($2\varepsilon$). In other words, we are calculating the probability of $X$ at the point $x$ in proportion to the length of the interval.

Let me give you an example. Suppose you have a circular dart board of radius $1$. Your throw a random dart at this board. Let $X$ represent the distance from the dart from the center. Let us determine the likelihood function for $X$.

In this random experiment we assume that the random dart will hit some region in the darboard. Therefore, the possible values for $x$ range from $0$ to $1$. So the "support" of the random variable $X$ is the interval $[0,1]$.

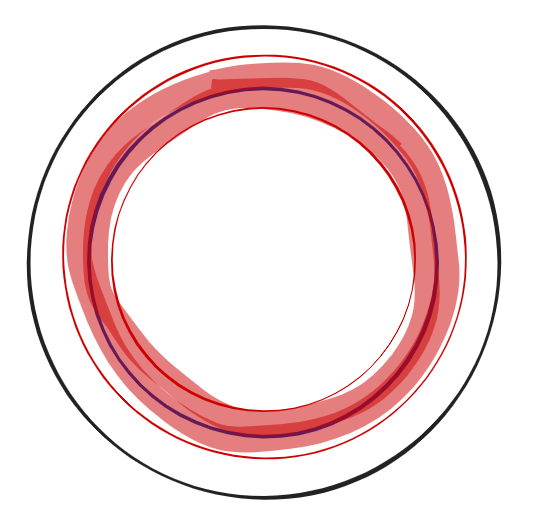
Now pick some $x$ within the support. To find the likelihood of $x$ we rather consider the probability that $X$ falls inside the region where $x - \varepsilon < X < x + \varepsilon$, see the picture below.

enter image description here

The region is an annulus with smaller radius $x-\varepsilon$ and larger radius $x+\varepsilon$. So the total area is equal to $\pi (x + \varepsilon)^2 - \pi (x - \varepsilon)^2$. The area of the entire dartboard is $\pi 1^2$ (since the radius is one). Therefore, the probability we land in this region is equal to, $$ \frac{ \pi (x + \varepsilon)^2 - \pi (x - \varepsilon)^2 }{ \pi } $$ To get the likelihood function we divide by the length of the interval and take the limit, $$ \lim_{\varepsilon \to 0} \frac{ \pi (x + \varepsilon)^2 - \pi (x - \varepsilon)^2 }{ 2\varepsilon \pi }$$ If you did this correctly you will get the answer as $2x$.

Therefore, the likelihood function is given by, $$ L(x) = \left\{ \begin{array}{ccc} 2x & \text{ if } & 0 < x < 1 \\ 0 & \text{ if } & \text{ otherwise } \end{array} \right. $$

Note, the likelihood function will exceed the value of $1$ at $x=1$. That is perfectly fine. The likelihood is not the probability, the likelihood is more of the proportion of the probability relative to the thickness of the interval.

$\endgroup$
2
  • $\begingroup$ Let me see whether I understood you properly. The likelihood is the proportion of probability at (infinitely close to) any x in X. Then how do we interpret values such as 2, 3 etc. (above 1), that within this infinitely small interval the probability that x takes on these values is relatively high - versus say elsewhere on the density function? How might we deal with a binomial distribution then $\endgroup$ Commented Nov 16, 2023 at 7:43
  • $\begingroup$ @AdmiralMunson When the likelihood of $X$ at the number $x$ is equal to $2$ then it means that the probability that $X$ lands in a small interval containing $x$ is twice as large as the interval itself. $\endgroup$ Commented Nov 16, 2023 at 14:33
1
$\begingroup$

Let $f_\theta$ be the probability (mass or density) distribution function of a random variable $X$, which depends on some given parameter $\theta$ then you can write:

$$ f_\theta(x)= f_\theta(x | \theta). $$

For example, you have a normal random variable $X$ with standard deviation $1$, but you don't know its mean $\mu$ (that acts like the above $\theta$). So you can have a family of functions $f_\mu$ parameterized by $\mu$:

$$ f_\mu(x) = f_\mu(x|\mu) = \frac{1}{\sqrt{2\pi}}e^{\frac{-(x-\mu)^2}{2}}. $$

Varying $\mu$ you will get different $f_\mu$'s and those $f_\mu$'s all belong the same family of functions where each one is characterized by a specific value of $\mu$. Of course, you can parameterize those functions based on $\sigma$ instead of $\mu$, or even both.

With that in mind, now given some fixed $x^\star\in range(X)$, the likelihood of $\theta$ is defined to be:

$$ \mathcal{L}(\theta|x^\star)=f_\theta(x^\star|\theta) $$

So in the normal distribution example above, it means that after you have a bunch of graphs of $f_\mu$'s with different $\mu$ values, now with $x^\star\in range(X)$ fixed and you can collect different values of $f_\mu(x^\star)$ according to different values of $\mu$'s. This maps each value of $\mu$ to $f_\mu(x^\star)$ (or $f_\mu(x^\star|\mu)$) given some fixed $x^\star$ and is called the likelihood function of $\mu$ (for some fixed $x^\star$).

For your question, assuming you have the Bernoulli distribution for $X$. Denote by $x$ the number of success outcomes after $n$ trial, then:

$$ f_p(x)= \binom{n}{x} p^x(1-p)^{(n-x)},\hspace{1em}x\in\lbrace 0 , 1, ..., n\rbrace. $$

then follow the above "procedure" you can clearly construct likelihood functions based on any fixed number of success outcomes of $X$ after $n$ trials. For example, fix $x=0$ you have

$$ \mathcal{L}(p|0)=f_p(p|0)=\binom{n}{0} p^0(1-p)^{(n-0)}=(1-p)^n. $$

It means that if you have zero success after $n$ trials then $\mathcal{L}(p|0)=(1-p)^n$. Notice that $\mathcal{L}(p|0)$ attains maximum value at $p=0$ which can be translated into "given zero success outcome on $n$ trials, it's natural to assume $p$=0".

$\endgroup$
0
-2
$\begingroup$

Basically, likelihood of given model (defined by specific parameters and their values) is defined as probability of observing the data under the given model. In other words, we have some observed data and we then define likelihood function which takes model parameters as input and yields probability (or probability density in the case of countinous values of data) of observing our data if the model with the respective parameters was true as the output.

In the coin toss example, we would define likelihood function for our observation as a function that would take various probabilities of heads as input and give conditional probability of observing data as output.

$\endgroup$
6
  • $\begingroup$ There's some truth to this, but it does seem to mix up probability and likelihood, which are not the same. Indeed, likelihood can exceed one! $\endgroup$
    – Dave
    Commented Nov 16, 2023 at 1:13
  • $\begingroup$ saying probability is not likelihood is almost meaningless, as probability itself without context has no meaning. The probability and likelihodd do not even take same input, it is just a straw-man. $\endgroup$
    – NeuroPanda
    Commented Nov 16, 2023 at 1:16
  • $\begingroup$ But you're the one who said that likelihood is a probability (which it is not). $\endgroup$
    – Dave
    Commented Nov 16, 2023 at 1:17
  • $\begingroup$ Likelihood function maps model parameters to conditional probability of observing our data given the model parameters. $\endgroup$
    – NeuroPanda
    Commented Nov 16, 2023 at 1:20
  • $\begingroup$ That is not true. Likelihoods can exceed one. Probabilities cannot. $\endgroup$
    – Dave
    Commented Nov 16, 2023 at 1:22

Not the answer you're looking for? Browse other questions tagged or ask your own question.