Question
What is the likelihood function for the event where 8 heads observed after 10 coin tossing?
Is below in Python/Scipy using (scipy.stats.binom) correct?
likelihood = []
for i in range(11):
    likelihood.append(binom.pmf(n=10,k=i,p=0.8))
For example, suppose the current probability distribution has the mean = 5 (fair coin/5 heads out of 10 toss). Then the Bayesian update will be:
likelihood = []
for i in range(11):
    likelihood.append(binom.pmf(n=10,k=i,p=0.8))

# first is prior, second is posterior
second = np.multiply(first, likelihood)
second = second / np.sum(second)
Is this correct?
Background
(I used 8 heads out of 10 above but the example below uses 4 heads out of 10. It was simply because 8 heads to 10 was far away from the prior. Apology for the confusion.)
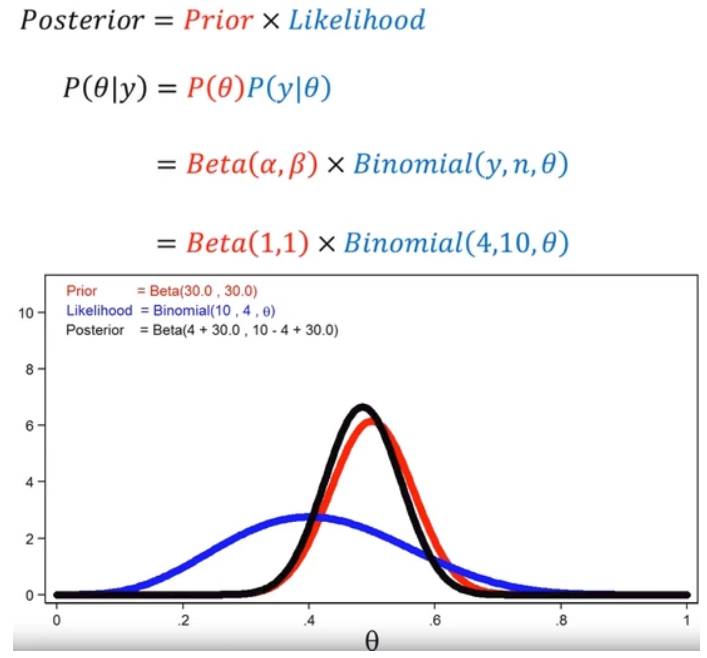
Introduction to Bayesian statistics, part 1: The basic concepts says that Bayesian regression posterior is prior x likelihood and normalisation, and the likelihood function for coin toss is binominal(10, 4, $\theta$) for 4 heads out of 10 toss.

I am not clear about the $p(y|\theta)$. I think it is the probability distribution for the event y (4 heads out of 10) to happen under some condition $\theta$, but what is $\theta$? Kindly explain what $\theta$ and $p(y|\theta)$ are in simple layman's English without mathematical formulas. In a way a grand-ma can understand.
As the event of 4 heads out of 10 toss to happen will be independent from the prior events, I suppose the likelihood function will be the binomial distribution of the coin that has 40% chance to have head at 10 coin toss.
Is this correct? If not, please explain why and how to get $p(y|\theta)$.
Code (Jupyter notebook)
import math
import numpy as np
from scipy.stats import binom

import statsmodels.api as sm
import matplotlib.pyplot as plt

%matplotlib inline


x = np.linspace(0, 10, 11)
y = [0] * len(x)

fig, ax = plt.subplots(1, 3,sharex=True,sharey=True)
fig.set_size_inches(20, 5)
#

# --------------------------------------------------------------------------------
# First
# 5 heads out of 10
# --------------------------------------------------------------------------------
first = []
for i in range(11):
    first.append(binom.pmf(n=10,k=i,p=0.5))

ax[0].grid(
    color='lightblue',
    linestyle='--',
    linewidth=0.5
)
ax[0].plot(
    [5],
    [0],
    linestyle="None",
    marker='o',
    markersize=10,
    color='r'
)
ax[0].vlines(x=x, ymin=0, ymax=first, colors='b', linestyles='--', lw=2)
ax[0].set_title('Initial 5 out of 10 toss')

# --------------------------------------------------------------------------------
# First + Second likelifood overlay
# Likelifood for having had 8 heads out of 10
# --------------------------------------------------------------------------------
ax[1].grid(
    color='lightblue',
    linestyle='--',
    linewidth=0.5
)
ax[1].plot(
    [5, 8],
    [0 ,0],
    linestyle="None",
    marker='o',
    markersize=10,
    color='r'
)
likelihood = []
for i in range(11):
    likelihood.append(binom.pmf(n=10,k=i,p=0.8))

ax[1].vlines(x=x, ymin=0, ymax=likelihood, colors='r', linestyles='-', lw=2)
ax[1].vlines(x=x, ymin=0, ymax=first, colors='b', linestyles='--', lw=2)
ax[1].set_title('8 out of 10 toss observed')

second = np.multiply(first, likelihood)
second = second / np.sum(second)

# --------------------------------------------------------------------------------\
# Posterior
# --------------------------------------------------------------------------------
ax[2].grid(
    color='lightblue',
    linestyle='--',
    linewidth=0.5
)
ax[2].plot(
    [5, 8],
    [0 ,0],
    linestyle="None",
    marker='o',
    markersize=10,
    color='r'
)
ax[2].vlines(x=x, ymin=0, ymax=second, colors='k', linestyles='-', lw=1)
ax[2].set_title('5 and 8 out of 10 toss')

plt.show()

