6
$\begingroup$

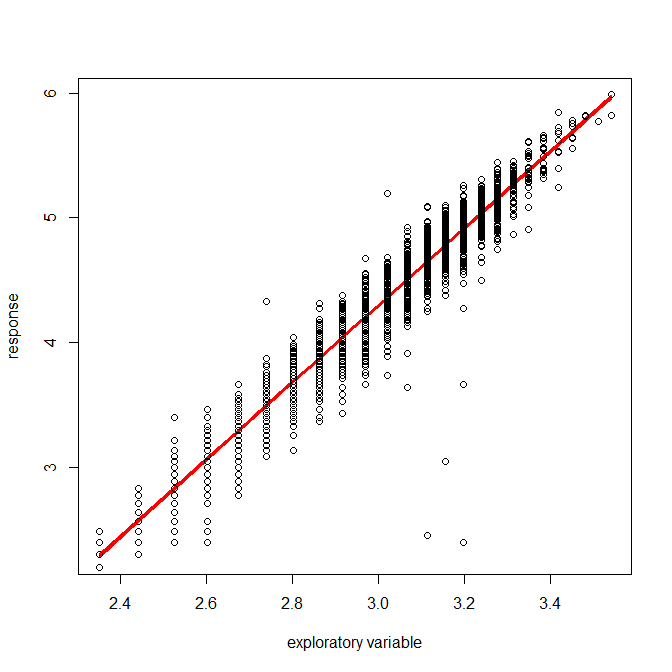
I am conducting a linear regression: $Y=\alpha+\beta\times X+\epsilon$, $\epsilon\sim N(0,\sigma^2)$. It turned out that the confidence interval for the predicted mean $Y$ was really small (figure 1), that it was hardly differntiable from the predicted mean. enter image description here
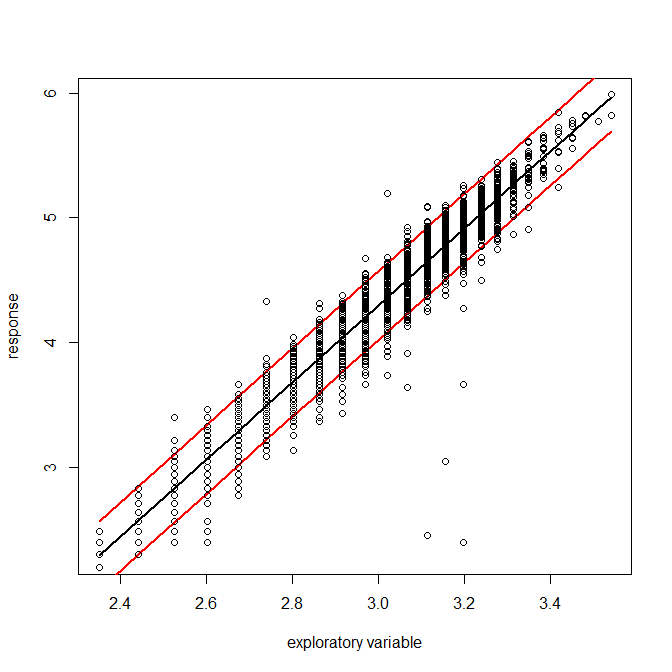
On the other hand, we can see that the observed $Y$s actually spread quite widely around each X. The second figure shows the predicted interval, which is large. enter image description here
My question is:

  1. What does this model tell me? Does it mean that it can be a perfect model to predict the mean? since the confidence interval in figure 1 is small.
  2. On the other hand, figure 2 tells that the random error in this model is high. Is there anything we can do (or is it necessary) to reduce such random error, although we already have a "perfect" model? For instance, will adding extra useful (assume) variables help further explaining (reducing) the random error?

Instead of asking what's the difference between these two types of intervals (see @whuber's link), I am interested in if a small confidence interval and a large prediction interval exist, what can we say and what can we do about such a model? is such model the best already and we should submit the result? Or something can still be done to further explain the random error? Can someone help me explaining this result?

Thanks

$\endgroup$
2
  • $\begingroup$ It's a well-formulated question, better than similar ones that preceded it. Nevertheless, I believe you will find it adequately answered here. I have modified your tags to give you ready access to many related threads: just click through the tags to read them. If you have follow-on questions, then please edit your text to show how they differ from the apparent duplicate. $\endgroup$
    – whuber
    Commented Jul 10, 2013 at 19:56
  • 2
    $\begingroup$ This pattern is expected: In figure 1, you've plottet the confidence band for the regression line which represents the uncertainty about the line. In figure 2, you've plottet the prediction bands which represents the uncertainty about the value of a new data-point. See also here. $\endgroup$ Commented Jul 10, 2013 at 20:01

2 Answers 2

2
$\begingroup$

Very little can be said in general terms about this sort of situation. We certainly can't conclude that this is the best model and just submit it. There may be other variables that are better than this one, or that complement it well by explaining the remaining randomness. To answer the question "what should I do here" is basically to consider the whole world of modelling strategies. You might want to consider a book such as Frank Harrell's on Regression Modeling Strategies.

$\endgroup$
0
$\begingroup$

To add some information to my own question, I could imagine that the predictor $X$ is length, and response $Y$ is weight. In this case, length perfectly predicts the average weight. However, the random error at each length is high.

We could imagine a second predictor Country {Asia, Europe, America...} and it satisfies that at a given length, people from Europe or America has averagely a higher weight than people from Asia. Therefore, by adding this extra variable, we could stratify the current model into two models (Europe+America vs. Asia), and each model with smaller random error.

So my suggestion is that when we judge how good the model is, we should not only look at the p-value and CI for the fitted variables included in the model, but we should also look at how much variance was actually explained by the model (e.g. R_square) (in this case the $R^{2}$ might not be very informative due to the replicates at given x). Adding more predictors could further decrease the random error in the model.

$\endgroup$
1
  • $\begingroup$ Better to edit your question to include this extra information than to have it as an "answer" - that can be quite confusing for the reader. Unless you believe you have answered your own question. $\endgroup$ Commented Jul 20, 2013 at 2:04

Your Answer

By clicking “Post Your Answer”, you agree to our terms of service and acknowledge you have read our privacy policy.

Not the answer you're looking for? Browse other questions tagged or ask your own question.