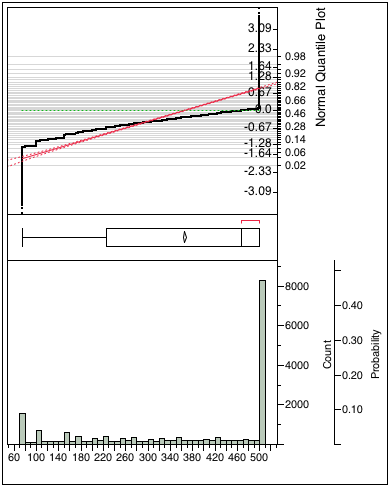
I would like to model the performance of a rainwater tank, which has a stochastic input (rainfall). The data are the empty volume in the tank at the end of each day. The values are skewed towards the extremes, and I am not sure how to model this or present it statistically. Reviewing various distributions in Wikipedia, I found that it seems like a Beta Distribution - but I am not sure whether it is one. I need to find a statistical method of representing the 'empty volume'.
One friend suggested that I use binomial distribution of getting probability of tank being 25% empty, 50% empty or 75% empty and find confidence intervals associated with those values.
Here is the distribution of my data:

EDIT - 11 July 7:28 GMT (following comments for clarification)
The inflow into the tank occurs randomly due to the rainfall. There is regular abstraction from the tank if there is stored volume.
I would like to estimate the probability of the empty volume in the tank on any random day in future based on the the historic data, and associated confidence of that probability.
I would then like to use that 'empty volume' figure to estimate how much of a large storm rainfall it can a large number of such tanks hold back and reduce the flash flooding volumes. Possibly may need to present combined probabilities with the storm probability.
