3
$\begingroup$

The title says it all: Is F-score the same as accuracy when there are only two classes of equal sizes?

For my specific case, I have measurements of a group of people under two different situations and wish to be able to classify based on the measurements. I therefore have 50 measurements for situation A, and 50 for situation B. In this situation, will F-score always be the same as accuracy, and, actually, precision and recall too?

(And if so or not, please explain why.)

$\endgroup$

2 Answers 2

5
$\begingroup$

No.

The F-score is a weighted average of precision (accuracy among predicted positives) and recall (accuracy among actual positives). Neither measure says anything at all about the group of true negatives and how well you classified them, but overall accuracy evaluates performance across all samples. Any metric that totally ignores the true negative group is ignoring data required to evaluate accuracy.

Suppose you have 100 items, 50 of which are actually positive and 50 of which are actually negative. You predict 10 items as positive and get none of them right, and 90 items as negative and get 40 of them right. Your precision is 0 (none of your positive predictions were right) , your recall is 0 (you haven't identified any actual positives), so any F-score must also be 0, despite the fact that your accuracy is 40%.

$\endgroup$
2
  • $\begingroup$ The accuracy should be 40%, shouldn't it? If you already labeled 10 out of 50 negative items as positive, only 40 remain to be identified correctly. $\endgroup$
    – trolley813
    Commented Feb 23 at 8:58
  • 1
    $\begingroup$ @trolley813 Thanks, fixed. $\endgroup$ Commented Feb 23 at 12:48
4
$\begingroup$

NO, see the counterexample below

Classify every instance the same way. You have a recall of $1$, a precision of $0.5$, and an accuracy of $0.5$. However, your $F_1$ score is:

$$ F_1 = 2\dfrac{\text{precision}\times\text{recall}}{\text{precision}+\text{recall}} = 2\dfrac{0.5\times 1}{0.5 + 1} = \dfrac{1}{1.5} = \dfrac{2}{3}\ne 0.5=\text{Accuracy} $$

A simulation can show many counterexamples where accuracy, recall, precision, and $F_1$ are different, despite the balance.

library(MLmetrics)
set.seed(2024)
R <- 1000
N0 <- N1 <- 50
N <- N0 + N1
y_true <- rep(c(0, 1), c(N0, N1))
accs <- precs <- recalls <- f1s <- rep(NA, R)
for (i in 1:R){
  y_pred <- rbinom(N, 1, 0.5)
  
  accs[i] <- MLmetrics::Accuracy(y_pred, y_true)
  precs[i] <- MLmetrics::Precision(y_pred, y_true)
  recalls[i] <- MLmetrics::Recall(y_pred, y_true)
  f1s[i] <- MLmetrics::F1_Score(y_true, y_pred, 1)
  
}
d <- data.frame(
  Accuracy = accs,
  Precision = precs,
  Recall = recalls,
  F1 = f1s
)
plot(d)
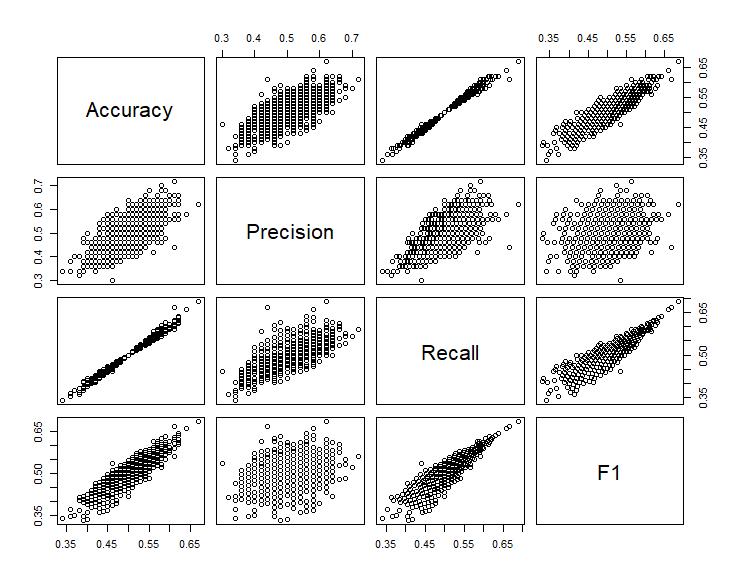
plot the performance metrics

Equality would require the points to lie along the line $y = x,$ which is false for all of the pairs shown above.

$\endgroup$
1
  • $\begingroup$ Precision and recall (and therefore F1) are information retrieval metrics, intended to quantify the relevance of items in a search result. IMO they are less suitable for classification problems (although they are very widely used as such). In your example classifying every instance as class A leads to a recall of 1 for class A, but the recall for class B is 0. Taking that into account would also change the comparison with accuracy (which is cross-class by definition), although it would still not be equal to the average F1. $\endgroup$
    – Marijn
    Commented Feb 23 at 12:17

Your Answer

By clicking “Post Your Answer”, you agree to our terms of service and acknowledge you have read our privacy policy.

Not the answer you're looking for? Browse other questions tagged or ask your own question.