0.05 is not at all "close to" 0.975.
If your tables only have upper tail area critical values, then you need to make use of the fact that the critical value $x$ for $F_{(p,\nu_1,\nu_2)}$ is the reciprocal of the critical value for $F_{(1-p,\nu_2,\nu_1)}$. (Note that the order of the df swapped, as well as which tail.)
This means, for example, that if $n_1-1 = 5$ and $n_2-1 = 13$ the lower tail 0.025 F critical value is the same as the reciprocal of the upper tail critical value (area of 0.025 to the right, or 0.975 to the left) for an F with $n_1-1 = 13$ and $n_2-1 = 5$. For example, checking this in R:
 qf(.975,13,5)
[1] 6.48758           #That is an upper tail critical value cutting off 0.025
 1/qf(.975,13,5)
[1] 0.1541407         #That's it's reciprocal
 pf(0.1541407,5,13)
[1] 0.025             #which cuts of 0.025 area in the lower tail when you swap the df
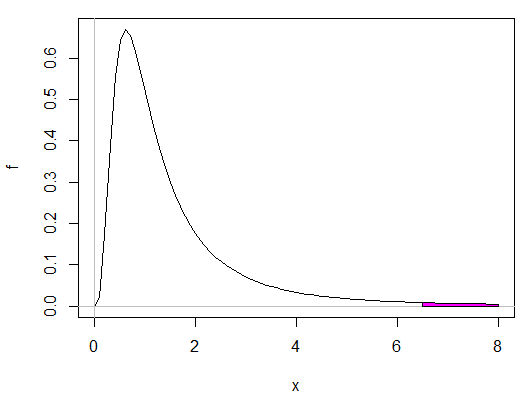
$\quad\quad\quad\quad\quad F_{(13,5)}(x);\text{Upper tail area = 0.025, }x=6.488$

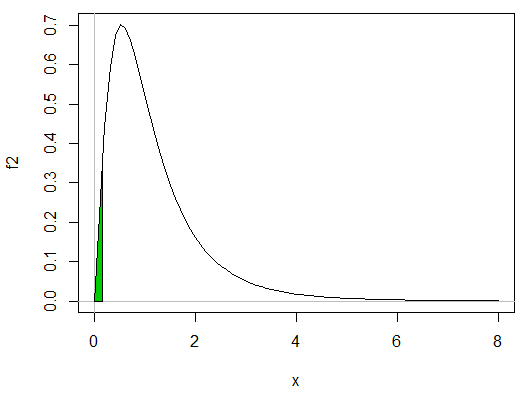
$\quad\quad\quad\quad\quad F_{(5,13)}(x);\text{Lower tail area = 0.025, }x=\frac{1}{6.488}$

(The pink area looks smaller than the green because more than half the pink area is further to the right of 8.)
So as we see, this handy fact allows you to get lower-tail F values when you only have upper tail F tables.
--
Edit: Following up a question from the comments
See here for a detailed explanation of the use of interpolation for critical values, including an example involving $\log(α)$


