0
$\begingroup$

$F<(1-\alpha/2, n_x-1, n_y-1)$ and $F>(\alpha/2, n_x-1, n_y-1)$. (Testing equality of population variances).

An alpha of $0.0$5 is used. $1-\alpha/2= 1-0.05/2= 1-0.025= 0.975$. However, there is no alpha value of $0.975$ in the $F$ table I have.

It only has alpha values of $0.05, 0.025, 0.01, 0.001$.

Do I simply use the alpha value closest to $0.975$, in this case $0.05$?

Or is there a way to actually read off $0.975$?

$\endgroup$
1
  • 1
    $\begingroup$ From your comments this is apparently for some subject. Please add the 'self study' tag. $\endgroup$
    – Glen_b
    Commented Jul 16, 2013 at 3:10

2 Answers 2

2
$\begingroup$

0.05 is not at all "close to" 0.975.

If your tables only have upper tail area critical values, then you need to make use of the fact that the critical value $x$ for $F_{(p,\nu_1,\nu_2)}$ is the reciprocal of the critical value for $F_{(1-p,\nu_2,\nu_1)}$. (Note that the order of the df swapped, as well as which tail.)

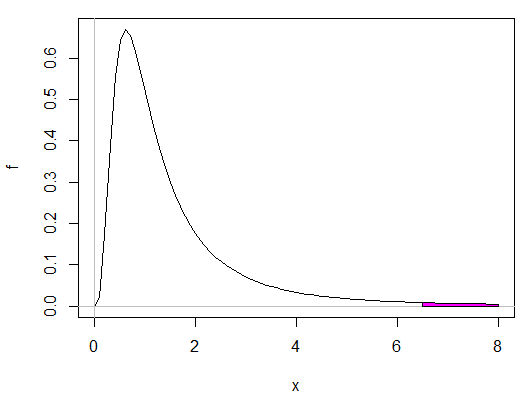
This means, for example, that if $n_1-1 = 5$ and $n_2-1 = 13$ the lower tail 0.025 F critical value is the same as the reciprocal of the upper tail critical value (area of 0.025 to the right, or 0.975 to the left) for an F with $n_1-1 = 13$ and $n_2-1 = 5$. For example, checking this in R:

 qf(.975,13,5)
[1] 6.48758           #That is an upper tail critical value cutting off 0.025
 1/qf(.975,13,5)
[1] 0.1541407         #That's it's reciprocal
 pf(0.1541407,5,13)
[1] 0.025             #which cuts of 0.025 area in the lower tail when you swap the df

$\quad\quad\quad\quad\quad F_{(13,5)}(x);\text{Upper tail area = 0.025, }x=6.488$ F 13,5,upper tail 0.025
$\quad\quad\quad\quad\quad F_{(5,13)}(x);\text{Lower tail area = 0.025, }x=\frac{1}{6.488}$ F 5,13, lower tail 0.025
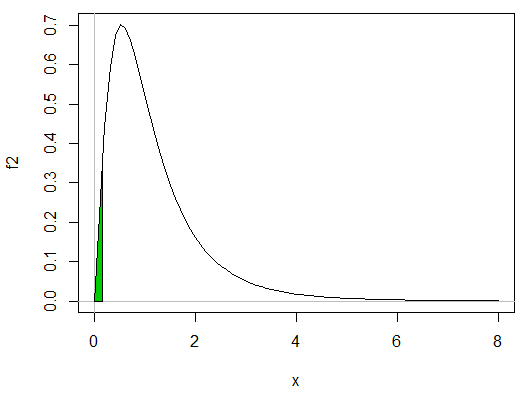
(The pink area looks smaller than the green because more than half the pink area is further to the right of 8.)

So as we see, this handy fact allows you to get lower-tail F values when you only have upper tail F tables.

--

Edit: Following up a question from the comments

See here for a detailed explanation of the use of interpolation for critical values, including an example involving $\log(α)$

$\endgroup$
11
  • $\begingroup$ Ok. So then as as long as the degrees of freedom are the same, the corresponding alpha values would also be the same? $\endgroup$
    – aboabo
    Commented Jul 15, 2013 at 0:00
  • 1
    $\begingroup$ Your question is insufficiently clear. Can you be more explicit? $\endgroup$
    – Glen_b
    Commented Jul 15, 2013 at 0:06
  • $\begingroup$ I was able to make more sense out of what you explained. However, I am now looking at a question with upper tail F being 0.2 and lower tail F being .98 . I am trying to apply what you explained but I am having difficulty as in this case, both 0.2 and 0.98 are not in the F table that I have. $\endgroup$
    – aboabo
    Commented Jul 15, 2013 at 19:14
  • $\begingroup$ Do you mean 0.02? So you have a combined alpha of 4%? Or are your ends really asymmetric? $\endgroup$
    – Glen_b
    Commented Jul 15, 2013 at 22:31
  • $\begingroup$ Yes, I mean .02 . "Construct the 96% interval for the ratio of two variances..." Therefore, alpha is 0.04. Right tail alpha is 0.04/2=0.02 and left tail alpha is 1-0.02= 0.98. So the two F's that I end up working with are .98 and .02. My F table does not have the values. It only has for 0.05,0.025,0.01,0.001. This is where I get difficulty applying what you explained as none of the 2 tail points are in the table. The numerator degrees of freedom are 14 and 10. $\endgroup$
    – aboabo
    Commented Jul 16, 2013 at 2:00
0
$\begingroup$

The usual comparisons with the F distribution are at the "right tail". Comparisons at the left tail could be done, but any identified discrepancy between the data and the model would imply the the model was fitting too well rather than measuring any "lack of fit".

If this is (as suggested by Glen_B) a request for assistance with the use of a ratio test for equality of variances, then perhaps consideration of a more robust and powerful alternative could be considered.

$\endgroup$
1
  • 1
    $\begingroup$ As indicated at the end of the first line of the question, the OP is trying to test a ratio of variances; that's a two-tailed test. $\endgroup$
    – Glen_b
    Commented Jul 15, 2013 at 1:48

Your Answer

By clicking “Post Your Answer”, you agree to our terms of service and acknowledge you have read our privacy policy.

Not the answer you're looking for? Browse other questions tagged or ask your own question.