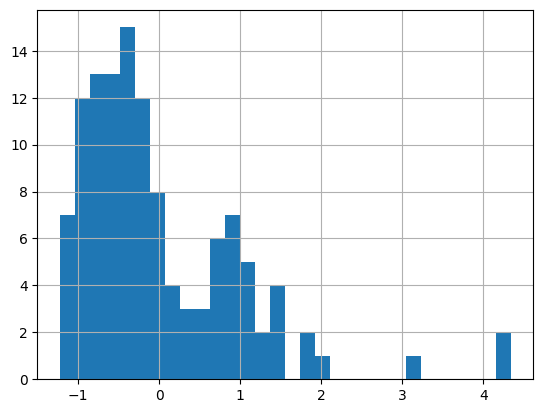
Unless you have a good reason, e.g. something like data is bi-modal, I would suggest modelling your task outcome as either beta or logit-normal distributed. e.g. something that respects form of your data. Normalizing the results, I would say, is a bad idea here.
If you want to compare two measurements of such variables (two earlier completetions vs two later completions), you can consider difference between them, but it would make more sense to me to compare the ratios, since a product of two numbers between 0..1 stays within the same range, the same cannot be said about differences.
So one way to go here may be to pose a model as follows:
$$
\begin{align}
\mu_i &\sim Normal\left(A,B\right)\\
\sigma_i^2 &\sim LogNormal\left(C,D\right) \\
r &\sim Beta\left(\alpha,\beta\right)\\
\eta_i^{(1,2)} & \sim LogitNormal\left(\mu_i,\sigma_i^2\right) \\
\eta_i^{(3,4)}/r & \sim LogitNormal\left(\mu_i,\sigma_i^2\right)
\end{align}
$$
So you model the first two task outcomes for $i$-th person ($\eta_i^{(1,2)}$) as coming from LogitNormal distribution with some person specific $\mu_i$ and $\sigma^2_i$, which in turn come from common distributions parametrized by $A,B,C,D$. If this is an overkill you can simply have single $\mu$ and $\sigma^2$ for all individuals. The difference between the outcome of the first two tasks and the last two tasks is extracted as the ratio $r$ which is modeled as a beta-distributed value. If you do want to stick with differences in the means, you could have something like:
$$
\begin{align}
\nu &\sim Normal(E,F) \\
\eta_i^{(3,4)}/r &\sim LogitNormal\left(\mu_i+\nu,\sigma_i^2\right)
\end{align}
$$
Either way, you end up fitting up to six constants to your data. This can be done in multiple ways, e.g. with MLE. I wrote the whole thing like a Bayesian problem, so that is also an option.
You wanted a test though. What would the null hypothesis be? That $r=1$ or $\nu=0$? If you estimate the distributions for these parameters it will be fairly straight-forward. Alternatively, something like Likelihood-ratio test could be attempted. It might be a good idea to do some simulations to understand what size of effect are you powered up to detect.

