2
$\begingroup$

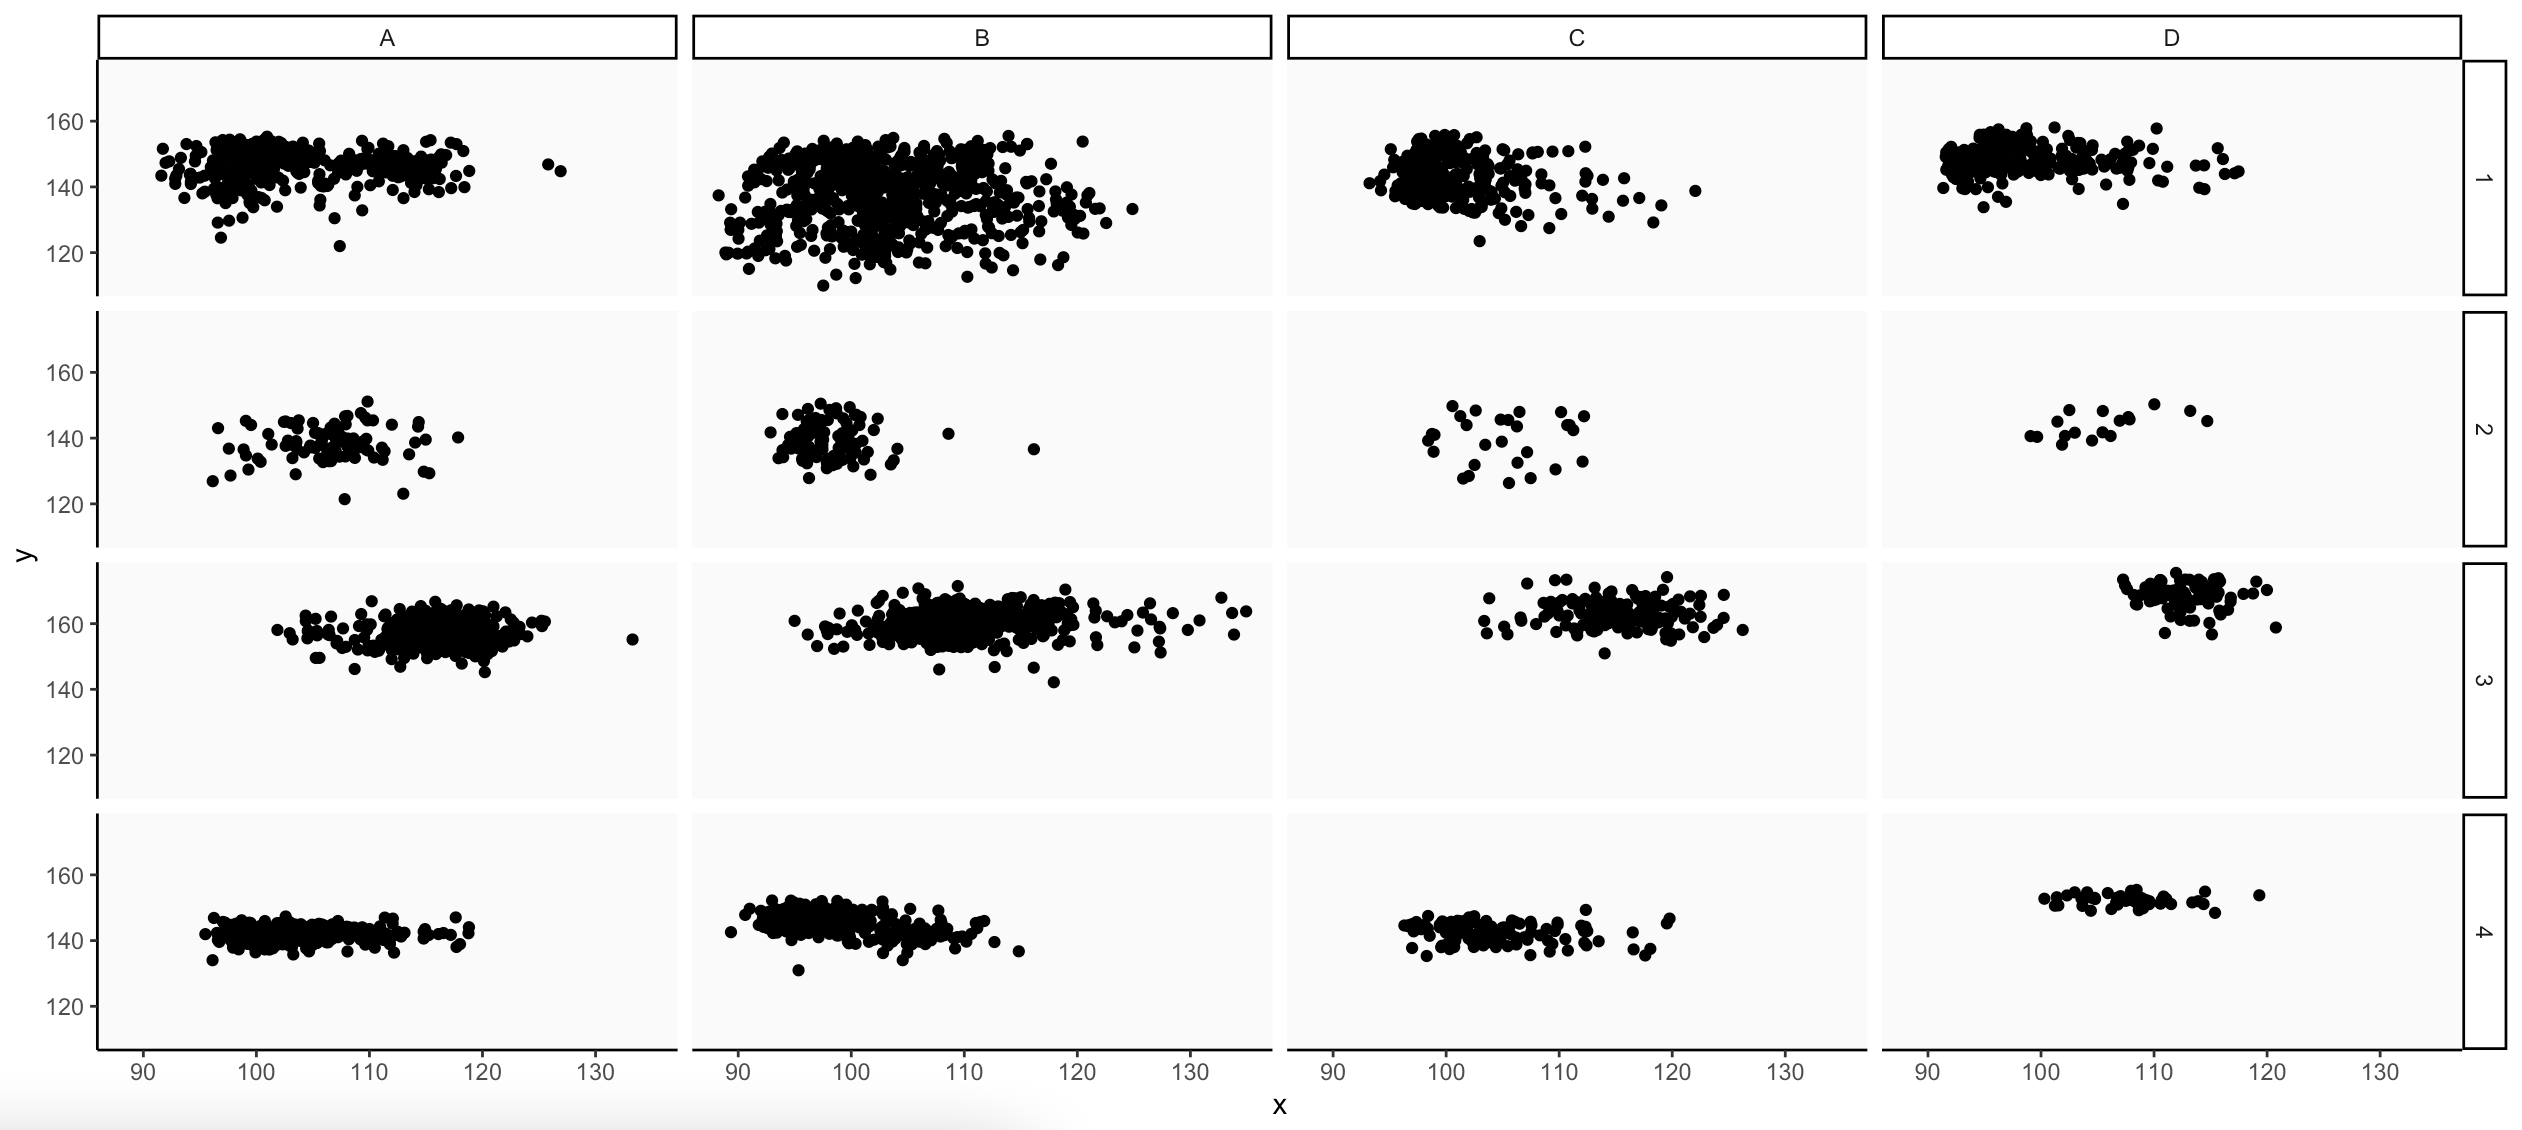
I'm trying to model complex relationships of a continuous predictor variable that has interactions with two categorical variables. I have skew in my samples as in that I have differing predictor ranges for each of the categorical combinations, as illustrated in this plot:

Scatterplot Matrix

If I now model this with mgcv::gam as

mod<-gam(y ~ s(x, by=interaction(Type,ID)) + ID + Type, data=dat, method='REML')
plot(mod, pages=1, scale=0, shade=T)

the resulting effect plots look like this: GAM effect plots
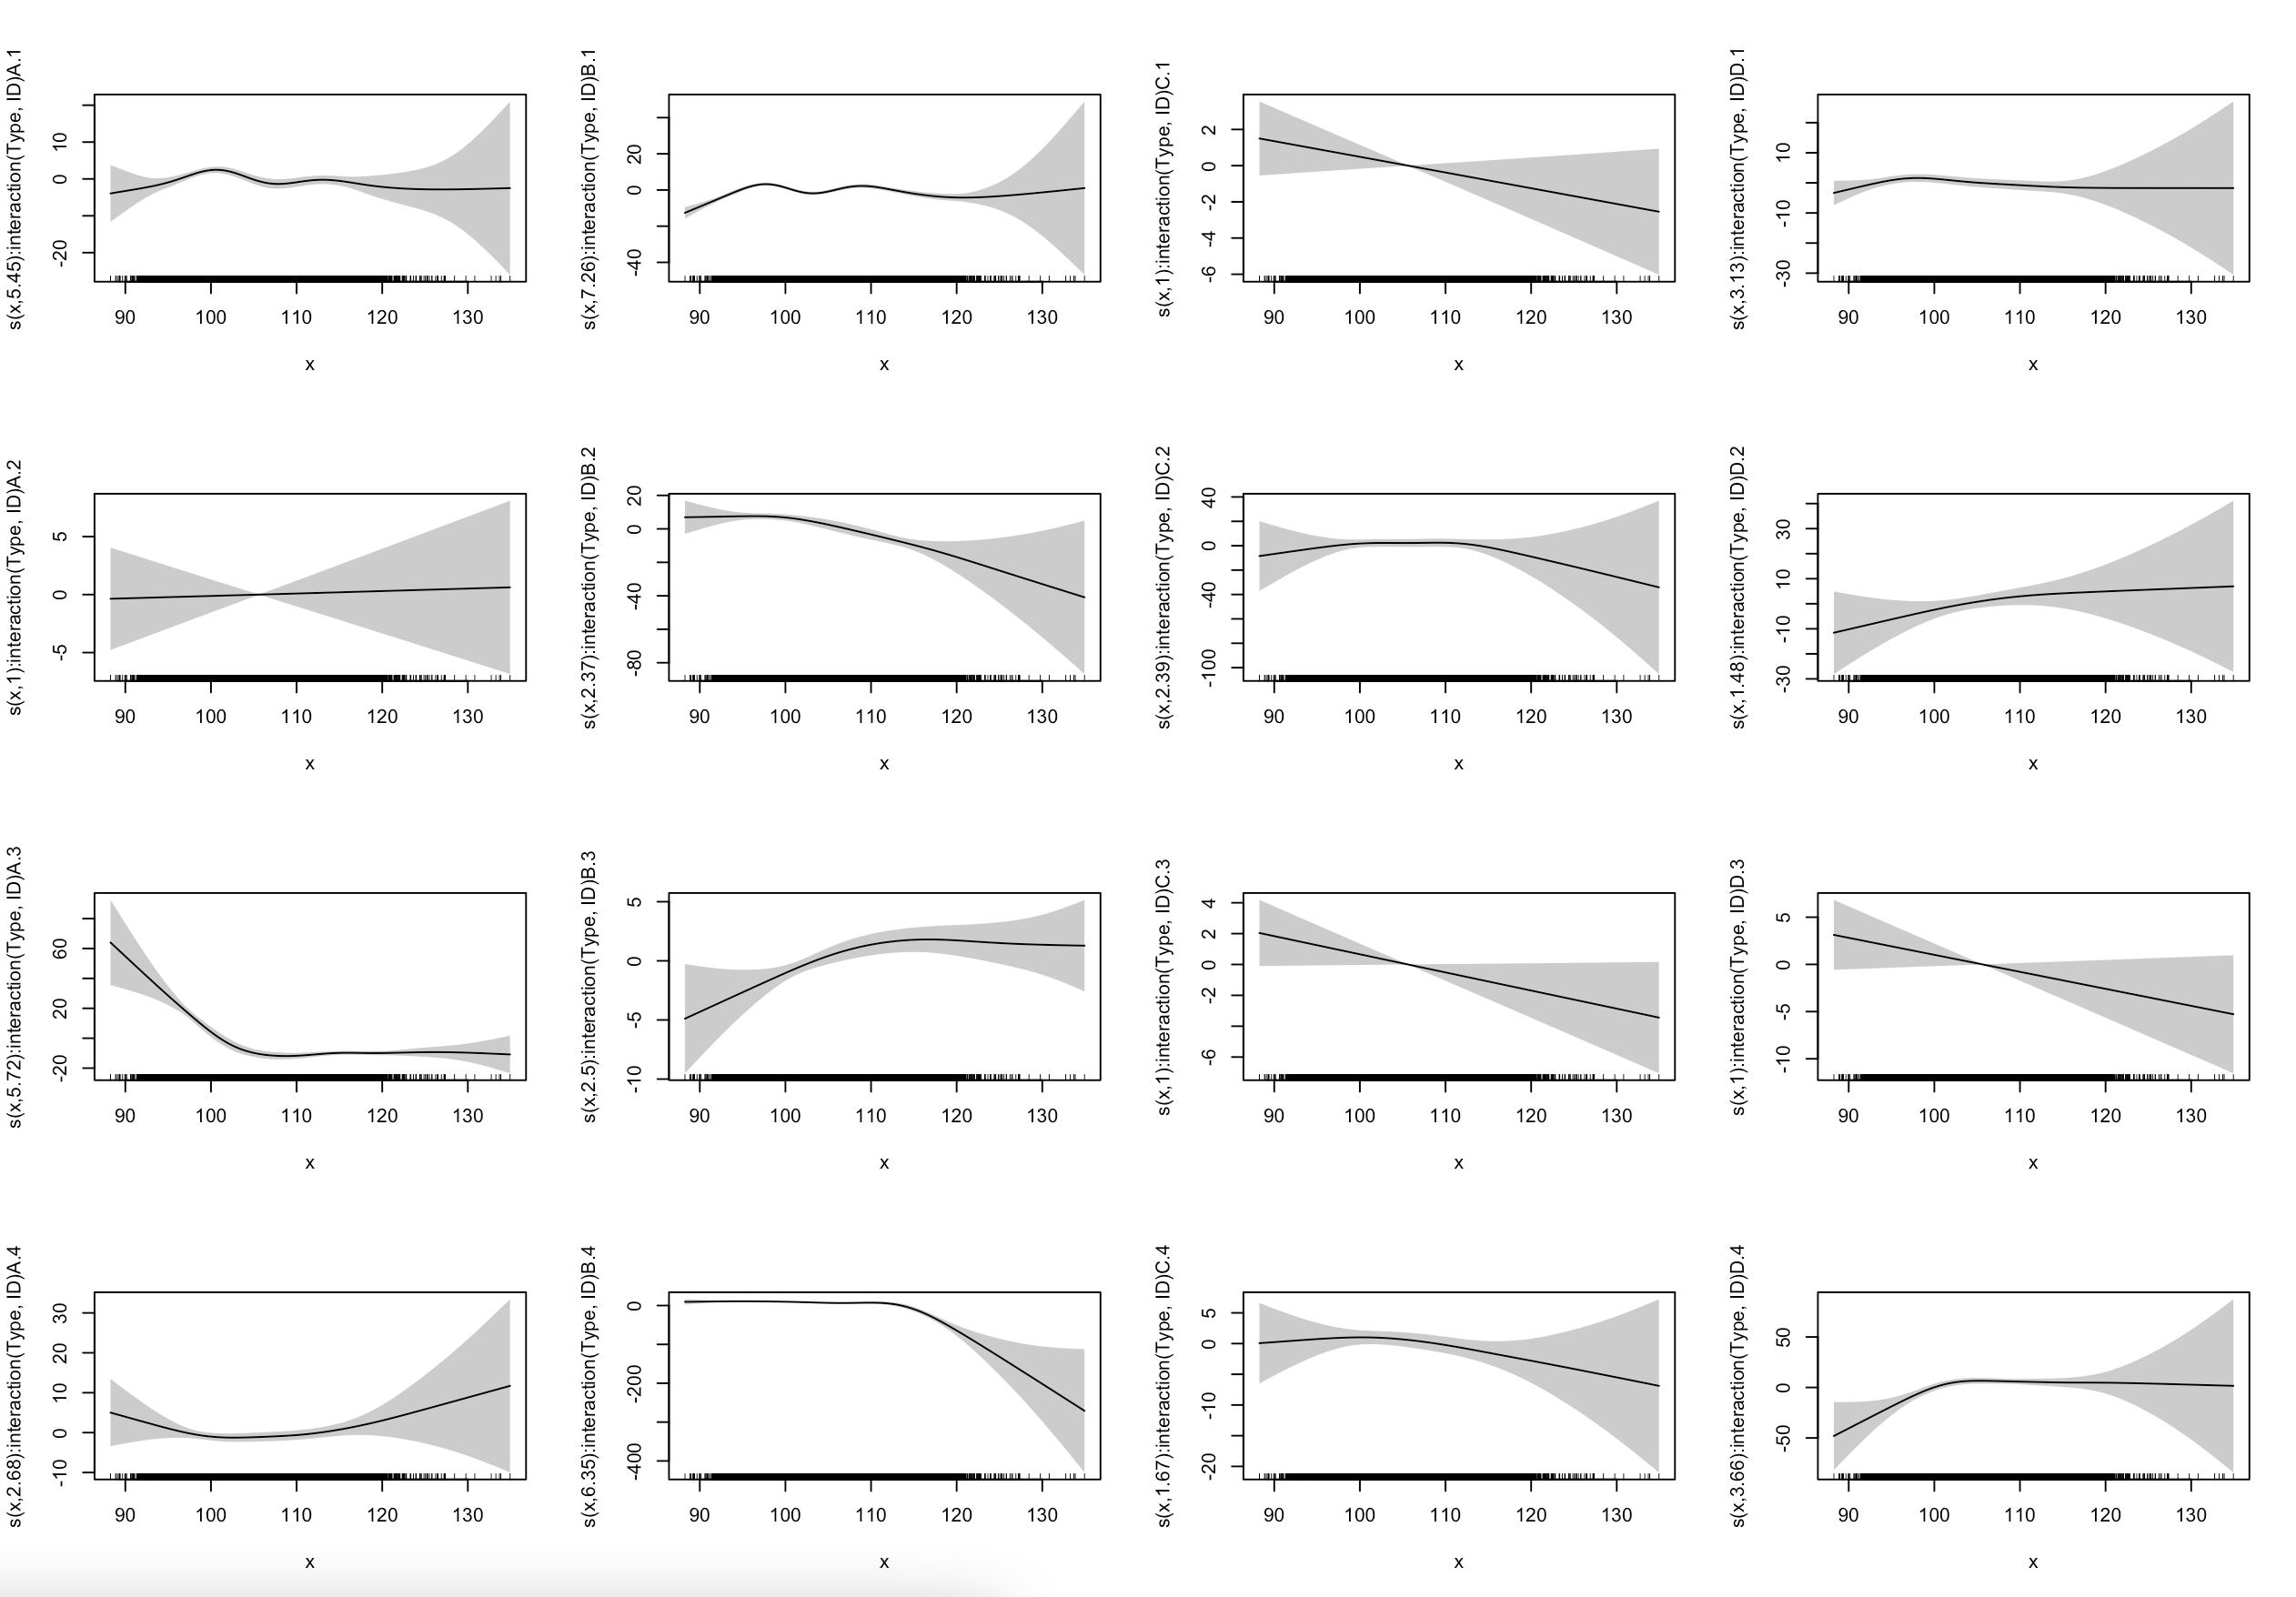
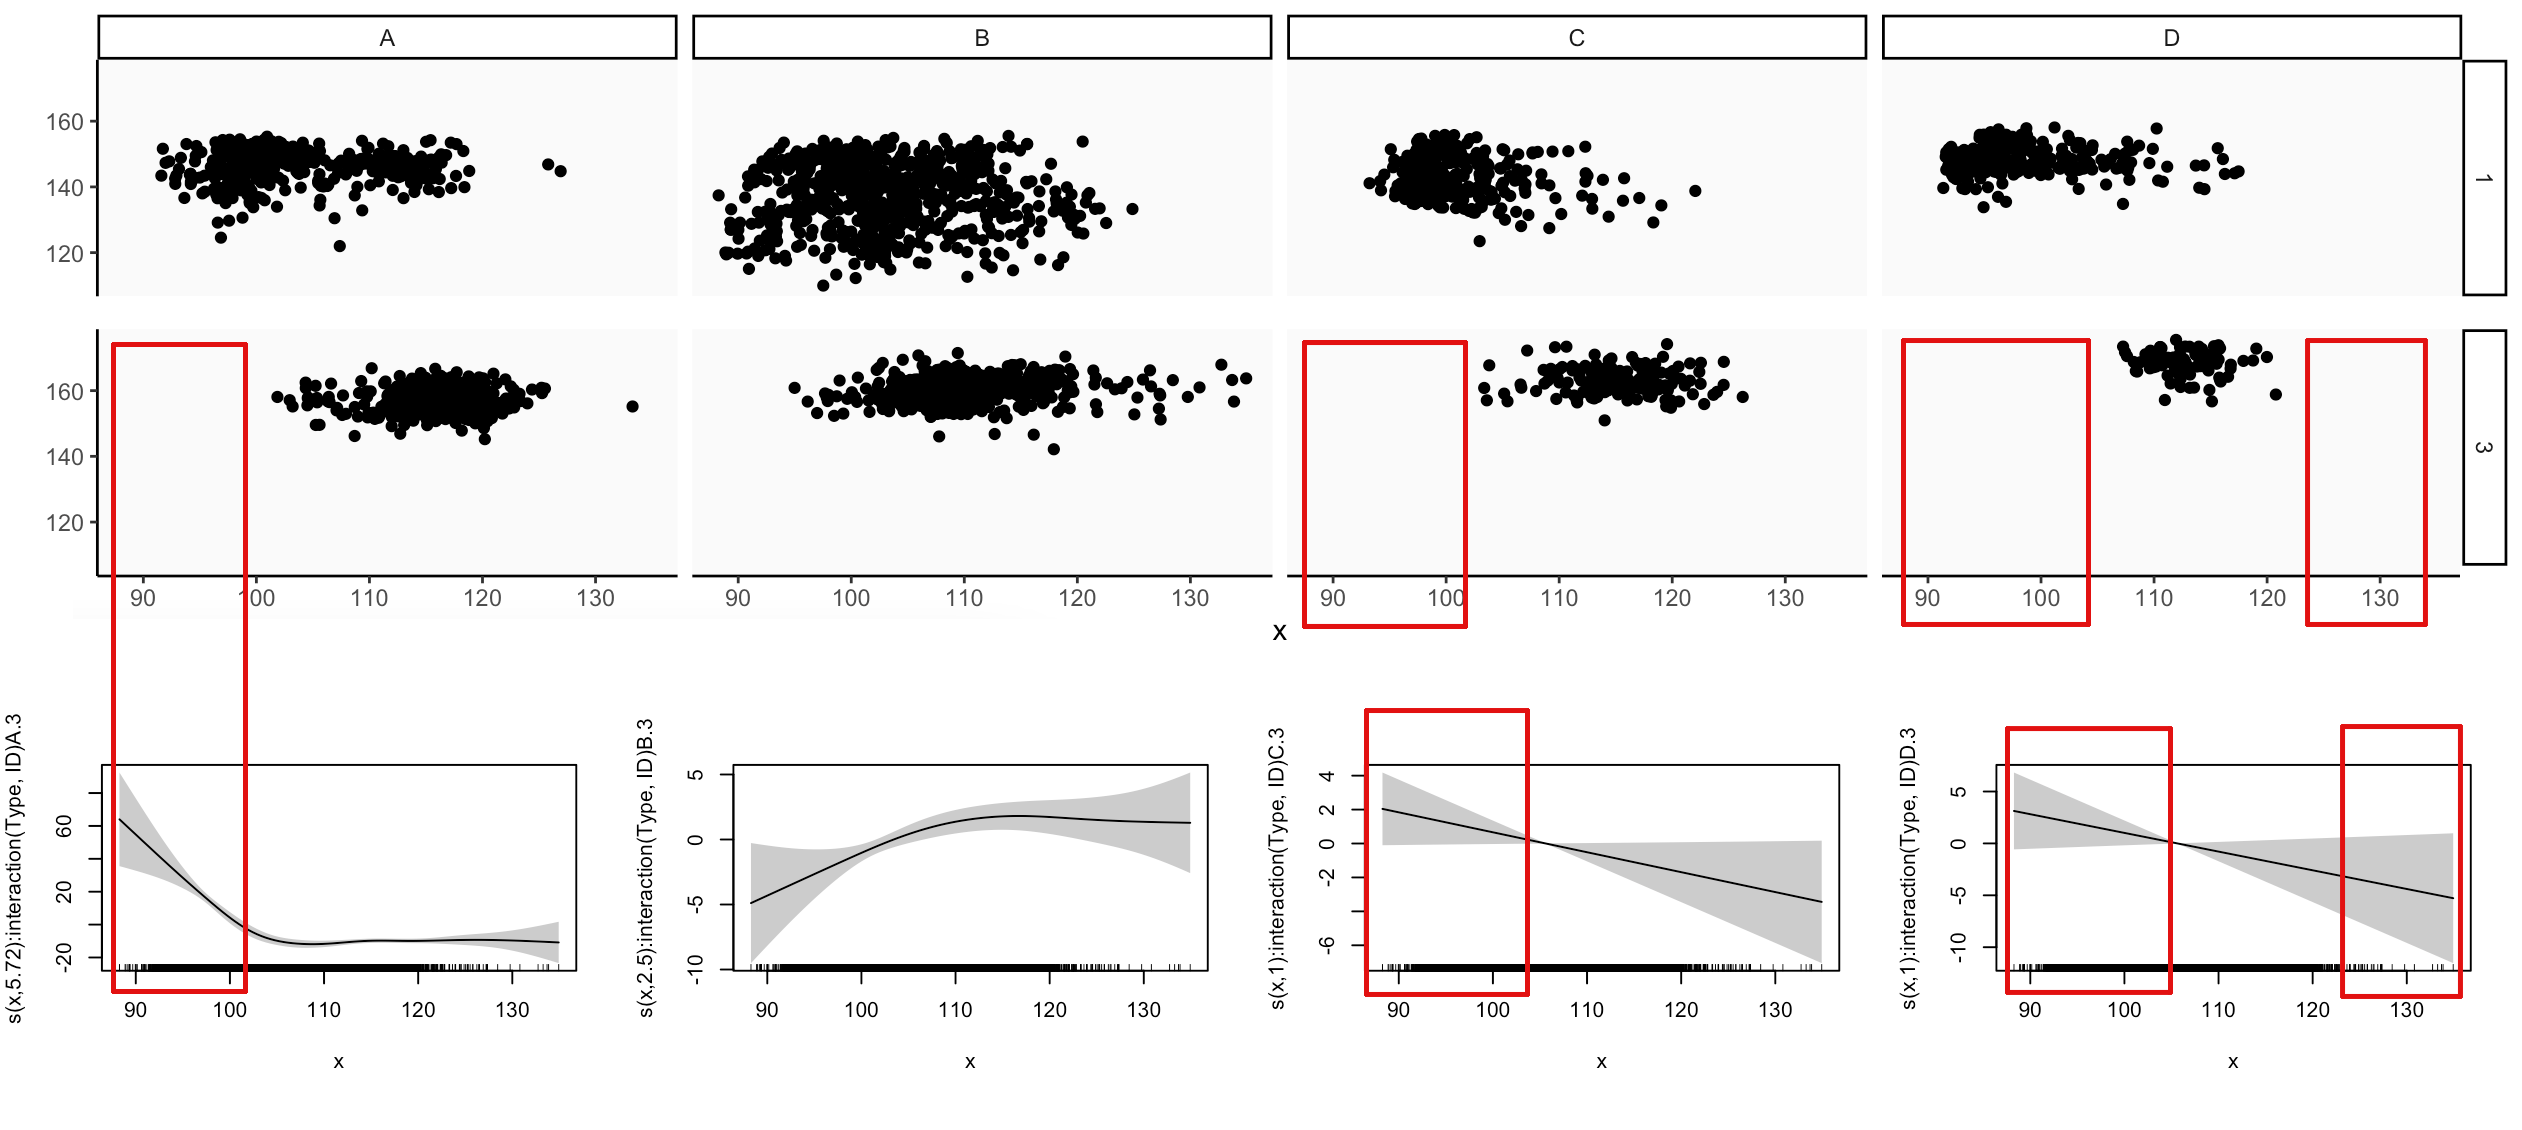
So, for each categorical combination, the effect plot shows a fit and rug over the entire pooled predictor range, e.g:

comparison

I'm wondering if I can even do this or if there is something I need to include in my model to control for this. Possibly, I just have to fit numerous single models? Because as far as I understand it, right now, it's fitting relationships over data that doesn't always exist, probably resulting in a spurious fit and significance? For example, x:A:3 is highly significant, but if I mentally take out that decrease at the beginning where no data exists for this combination, I see a mostly flat line...

In addition, do I need to be concerned over very differing sample sizes per categorical combination?

I know for sheer visualization, I can just extract the underlaying data used to create the effect plots and re-plot them while excluding data outside the range for each combination. But I want to make sure my model approach is even correct and the results valid. This is a simplified version for illustration purposes of a more complex model that includes additional predictors. In addition, while ID is a classic blocking variable, the effects of the different Types may possibly influence each other, making me think I really shouldn't fit individual models for each separate Type:ID combination, but then the problem of differing predictor ranges remains.

$\endgroup$

1 Answer 1

2
$\begingroup$

Your uncertainties are growing in over ranges where the splines are extrapolating to new data, so in the present model configuration the question is whether you are comfortable with the way this extrapolation happens (it goes linearly in whatever direction the spline was "wiggling" at the boundary). But you may also benefit from a hierarchical setup, where you could perhaps fit higher-level smooths that these lower level smooths are then regularized toward. For example, you could consider something like:

mod <- gam(y ~ s(x) +                              # shared smooth
            s(x, ID, bs = 'fs') +                  # avg. ID smooths
            s(x, Type, bs = 'fs') +                # avg. Type smooths
            s(x, interaction(Type,ID), bs = 'fs'), # lower-level smooths
           data = dat, method = 'REML')

The fs basis acts as "random" smooths here (which also implictly include random intercepts), so you are in effect fitting a "shared" smooth of x to learn the average shape from all the data at once. You are then allowing each level of ID to have its own "average" smooth, which acts as a deviation from the shared smooth. The rest of the model proceeds down the hierarchy. This would perhaps give you more efficient use the data structure. You may need to alter the types of penalties you use or the k values you impose to ensure you retain identifiability (see guidance from Pedersen et al on hierarchical GAMs). But overall it is good that you are investigating where these estimates come from when extrapolating to new data, it is often not well recognised that these functions extrapolate in this way.

$\endgroup$
5
  • $\begingroup$ Thank you, I'll read up on Pedersen et al. In the meantime, for your hierarchical suggestion, I have to questions: 1) I see you excluded the two categorical blocking variables, may I ask why? 2) Would I have to do the same hierarchical modeling for additional predictors that may show similar interactions with the two categorical variables, when I really only am interested in x and only include them to control for any variability possibly explained by those? I have two additional continuous covariates and that would become a very large and complex model pretty fast? $\endgroup$
    – Anke
    Commented Apr 18 at 13:07
  • $\begingroup$ Also, I just ran your suggestion and received the following warning Warning message: In gam.side(sm, X, tol = .Machine$double.eps^0.5) : model has repeated 1-d smooths of same variable.; is this something I do need to be concerned about? $\endgroup$
    – Anke
    Commented Apr 18 at 13:14
  • $\begingroup$ I removed the parametric effects because they are implicitly included in the fs basis. But if you need additional interactions with them then you add them back in. The warning can be safely ignored $\endgroup$ Commented Apr 18 at 20:07
  • $\begingroup$ Thank you! I have one more question; how is including "random smooths" different from fitting a mixed model with 'proper' random effects, i.e. a GAMM? I'm not very experienced with incooperating random effects in general. I'm trying to understand how the "random smooths" differ from "normal" smooths like I would normally do with interactions and how any of this affects what I ultimately see in all effects for my model. This obviously is crucial for interpretation. $\endgroup$
    – Anke
    Commented Apr 22 at 20:14
  • $\begingroup$ The fs smooths share a smoothing penalty, so they are forced to share the same amount of 'wiggliness'. This is what I meant by 'random', i.e. it is similar to the usual random effects which tend to share the same variance parameters. This makes them useful if, for example, you wanted to predict what kinds of shapes you would see if you were to take measurements for new groups that were not originally included in the model. But you can also view them as just a useful modeling technique to impose regularisation and squeeze information from structured data $\endgroup$ Commented Apr 22 at 22:15

Your Answer

By clicking “Post Your Answer”, you agree to our terms of service and acknowledge you have read our privacy policy.

Not the answer you're looking for? Browse other questions tagged or ask your own question.