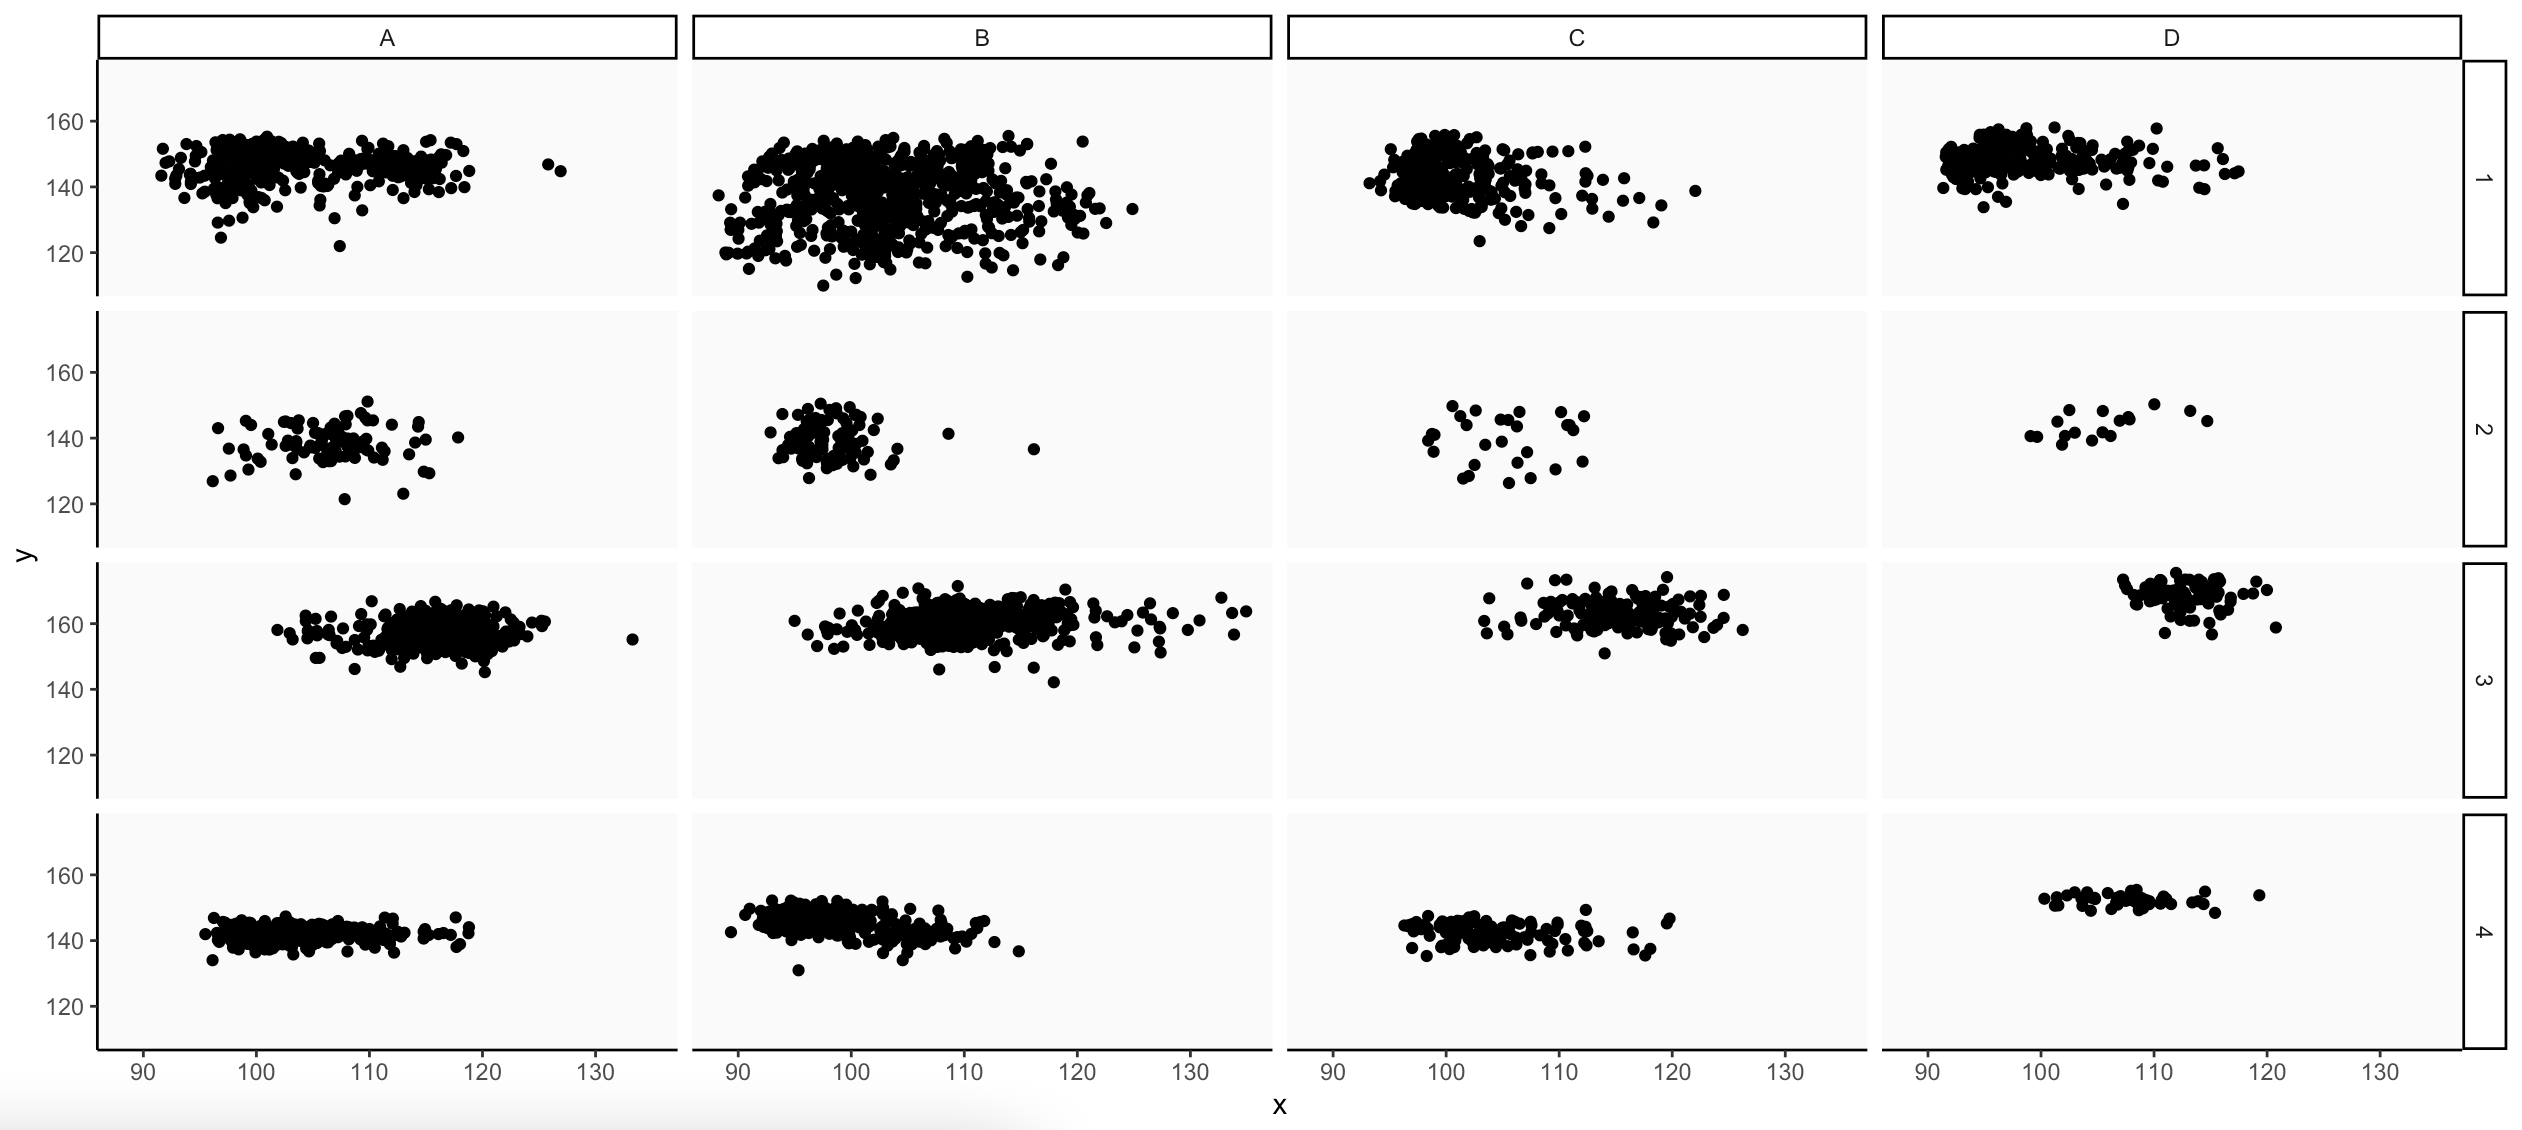
I'm trying to model complex relationships of a continuous predictor variable that has interactions with two categorical variables. I have skew in my samples as in that I have differing predictor ranges for each of the categorical combinations, as illustrated in this plot:
If I now model this with mgcv::gam as
mod<-gam(y ~ s(x, by=interaction(Type,ID)) + ID + Type, data=dat, method='REML')
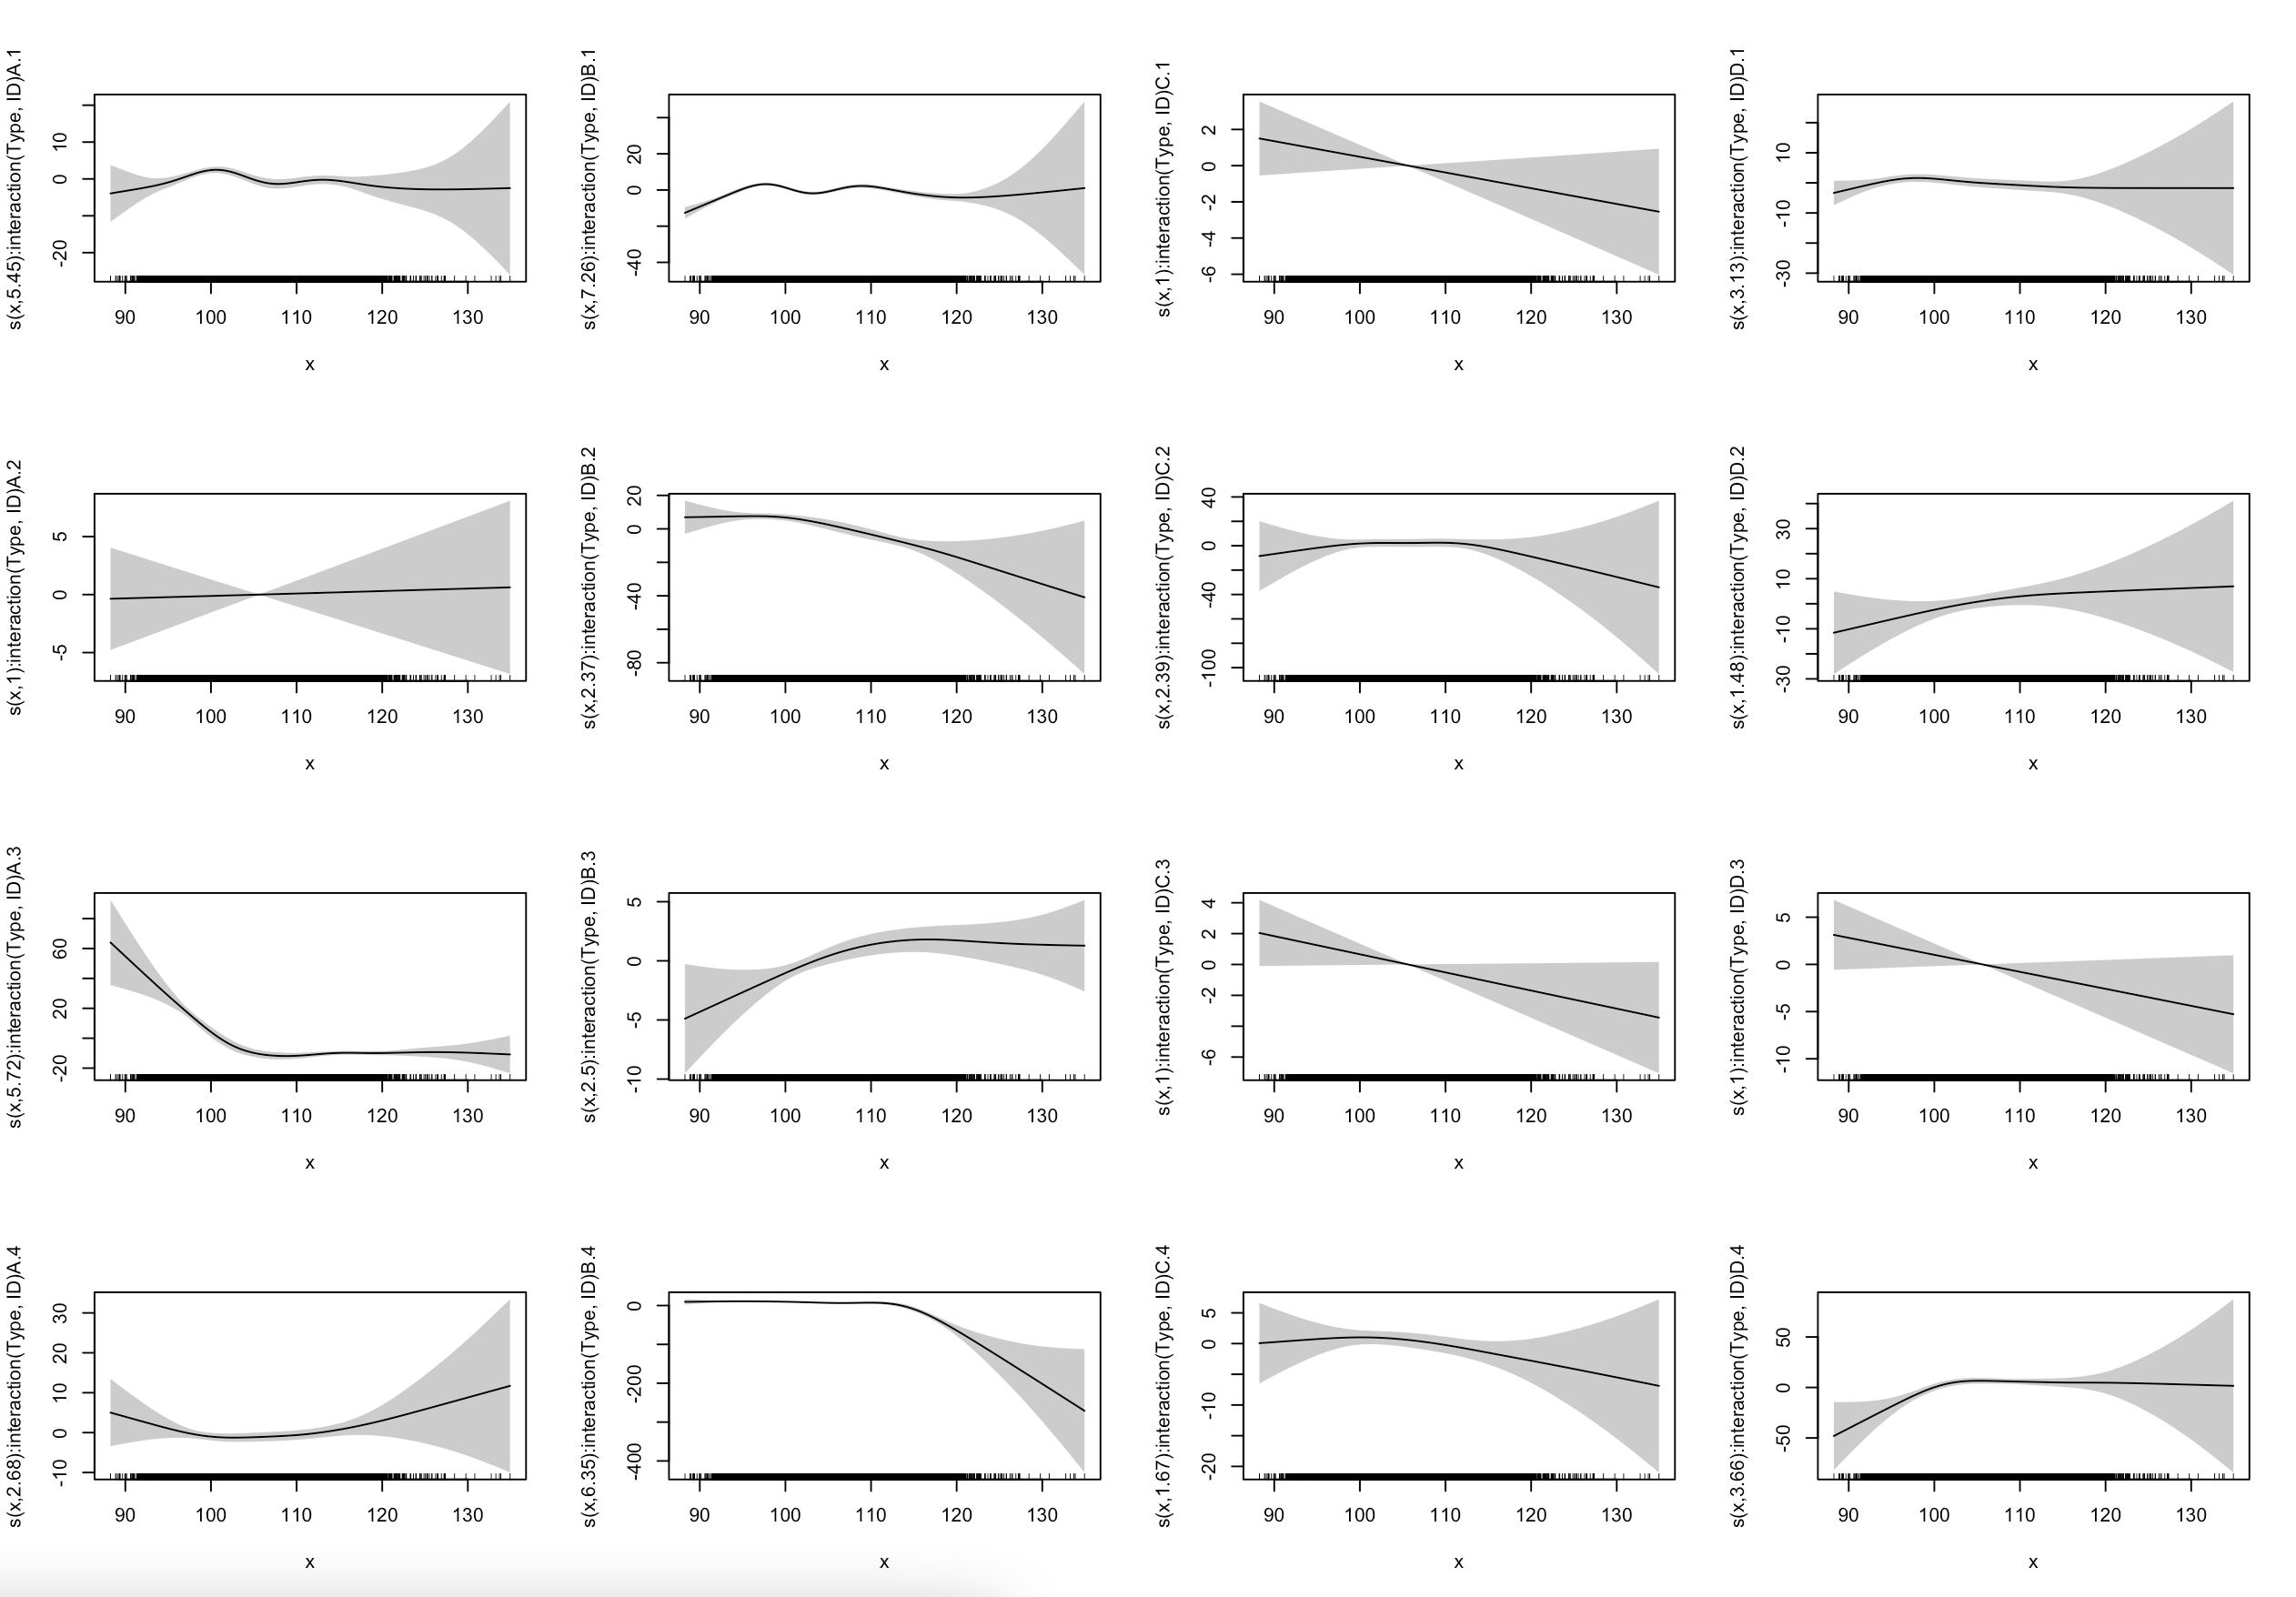
plot(mod, pages=1, scale=0, shade=T)
the resulting effect plots look like this:

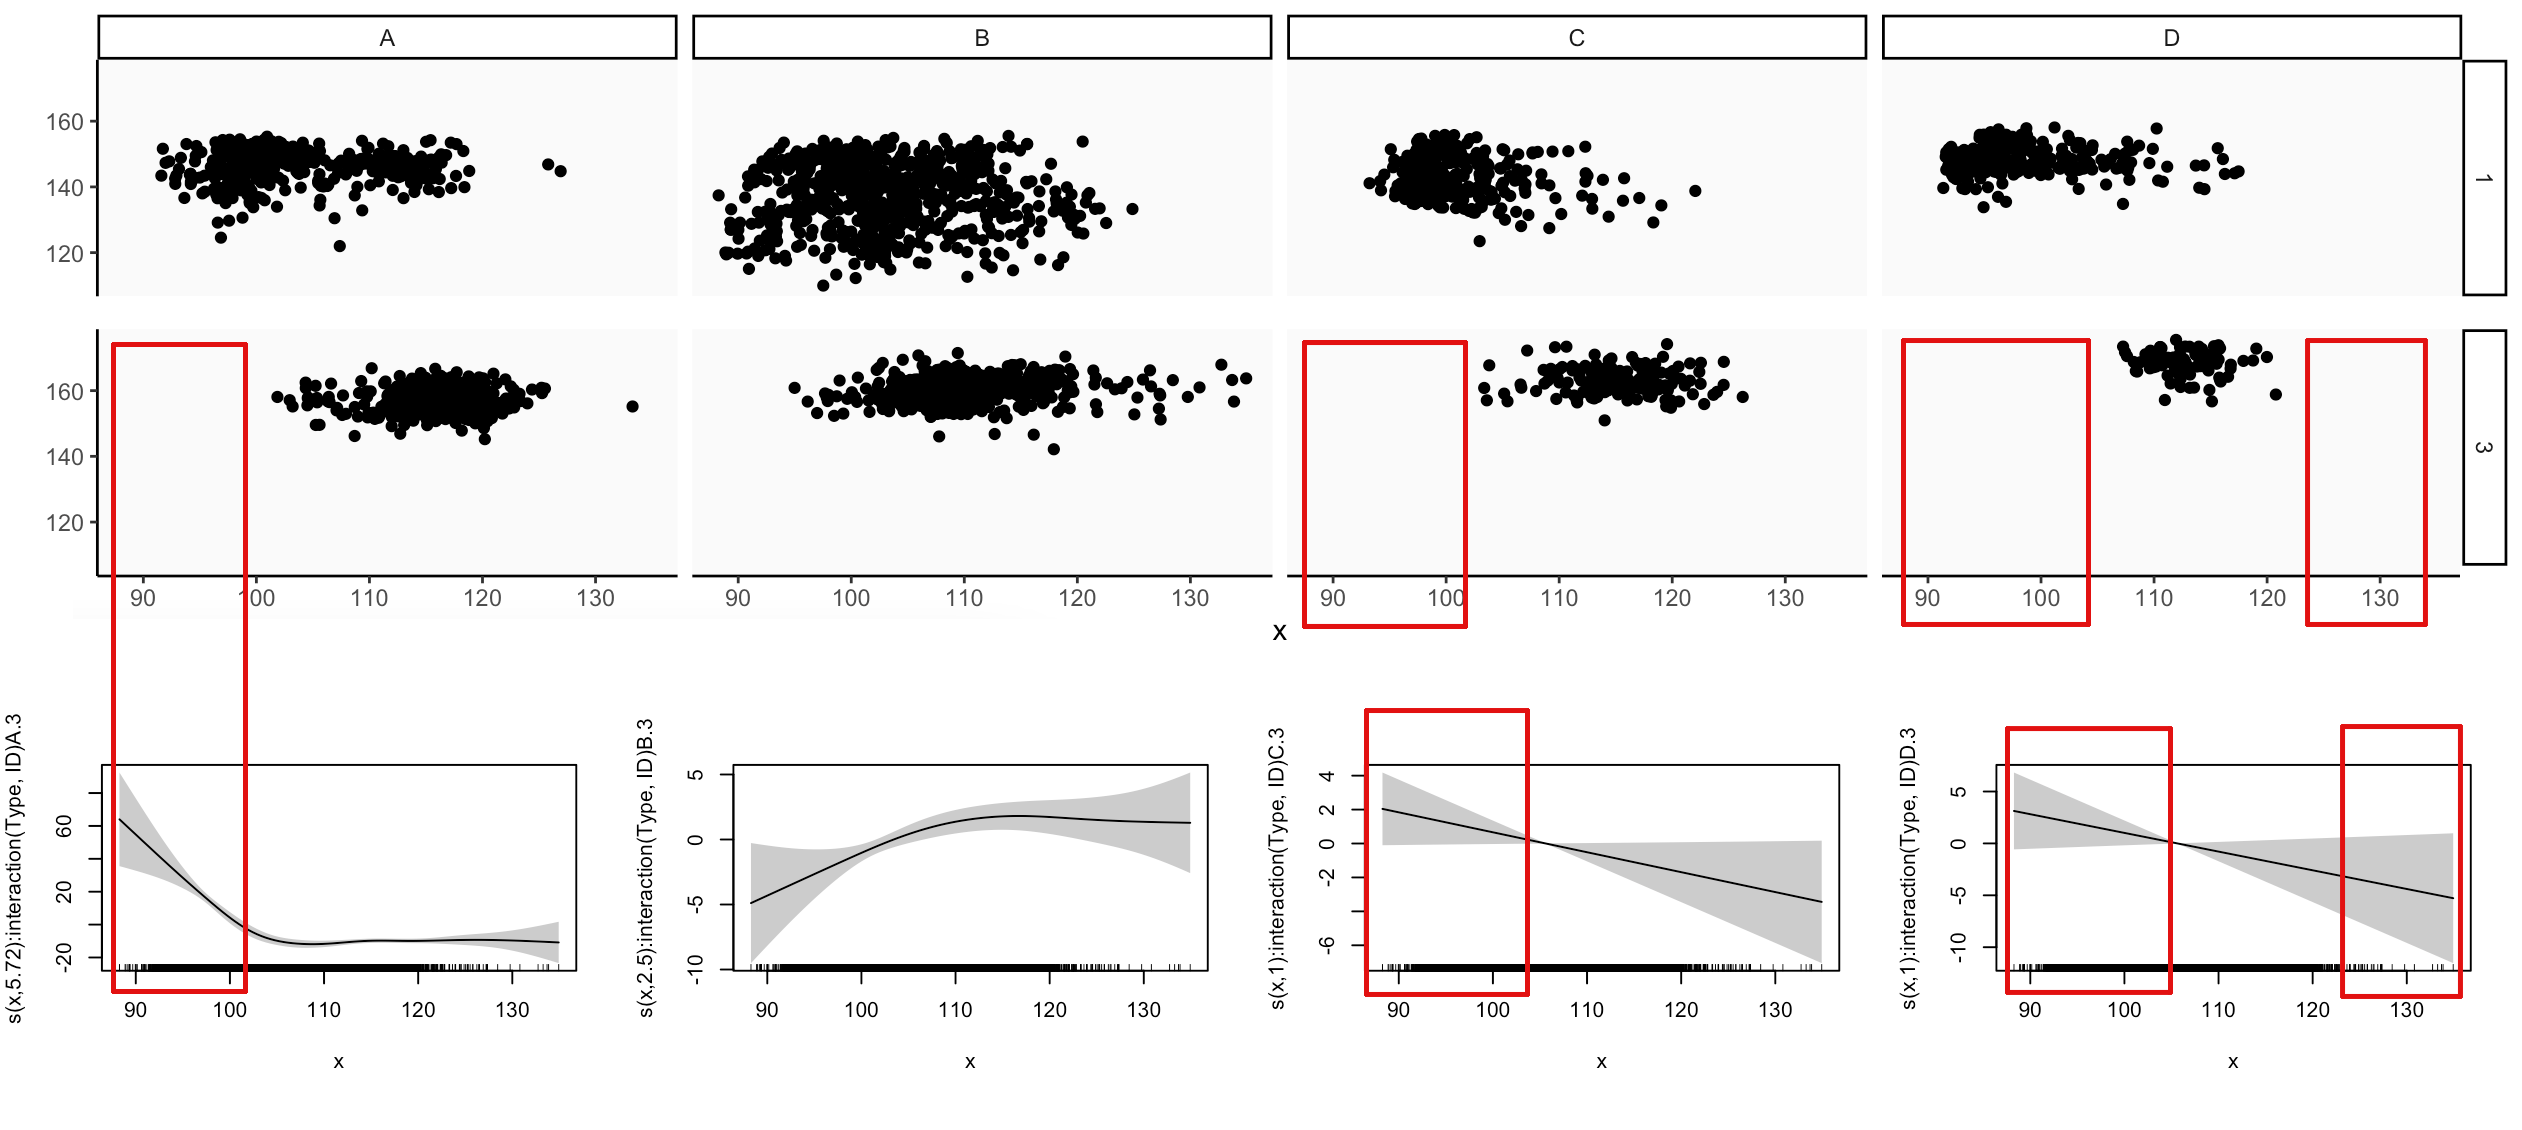
So, for each categorical combination, the effect plot shows a fit and rug over the entire pooled predictor range, e.g:
I'm wondering if I can even do this or if there is something I need to include in my model to control for this. Possibly, I just have to fit numerous single models? Because as far as I understand it, right now, it's fitting relationships over data that doesn't always exist, probably resulting in a spurious fit and significance? For example, x:A:3 is highly significant, but if I mentally take out that decrease at the beginning where no data exists for this combination, I see a mostly flat line...
In addition, do I need to be concerned over very differing sample sizes per categorical combination?
I know for sheer visualization, I can just extract the underlaying data used to create the effect plots and re-plot them while excluding data outside the range for each combination. But I want to make sure my model approach is even correct and the results valid. This is a simplified version for illustration purposes of a more complex model that includes additional predictors. In addition, while ID is a classic blocking variable, the effects of the different Types may possibly influence each other, making me think I really shouldn't fit individual models for each separate Type:ID combination, but then the problem of differing predictor ranges remains.


