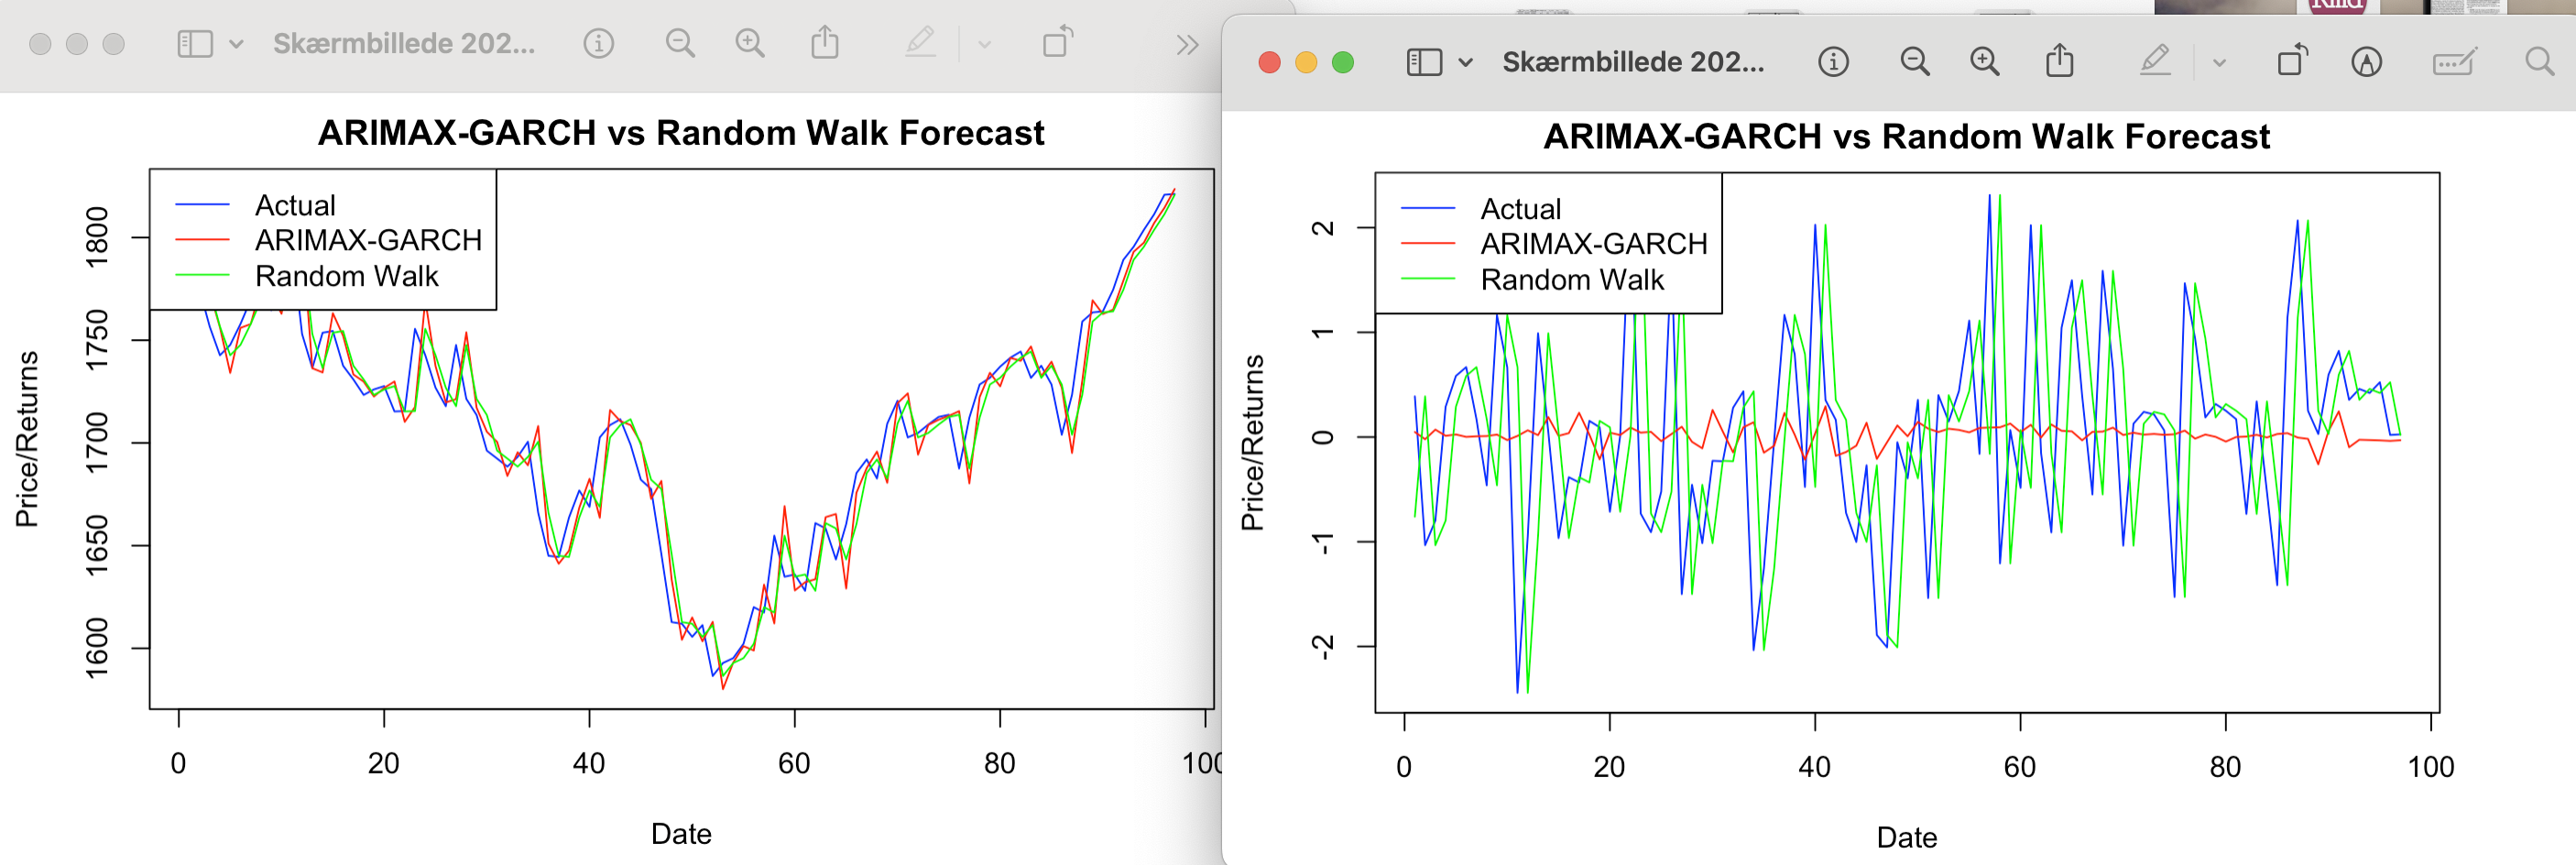
Whenever I do my ARIMAX-GARCH model for forecasting n-ahead with sentiment from news as my exogenous variable, the predictions seems normal when forecasting using level price of the stock, but it heavily underestimates close to 0 when using daily return in percent change or log percent change.
As seen below the curve flattens out, and the results seems weird when I use daily change in %.
Here is my code. I change variable in my zoo when using daily return etc.
library(readxl)
library(vars)
library(tseries)
library(zoo)
library(dplyr)
library(rugarch)
library(forecast)

# Loading Data
finbert_OMX5 <- read_excel("~/desktop/omxc25procent.xlsx")

# Preparing Data
dates <- as.Date(finbert_OMX5$date)
FINsentiment3 <- zoo(finbert_OMX5$finbert_change, dates)
OMXdaily_return3 <- zoo(finbert_OMX5$Price, dates)

# Combined
fin_zoo4 <- merge(FINsentiment3, OMXdaily_return3)
fin_zoo4 <- fin_zoo4[order(index(fin_zoo4)),]

# Split data into train and test
split_index <- round(0.8 * nrow(fin_zoo4))
train_data <- fin_zoo4[1:split_index, ]
test_data <- fin_zoo4[(split_index + 1):nrow(fin_zoo4), ]

train_data_core <- coredata(train_data)
test_data_core <- coredata(test_data)

# Random Walk Model
random_walk_forecasts <- lag(test_data_core[, "OMXdaily_return3"], 1)
random_walk_forecasts[1] <- tail(train_data_core[, "OMXdaily_return3"], 1)  # First element from last of train set

# ARIMAX-GARCH Model Setup and Forecasting
spec <- ugarchspec(variance.model = list(model = "sGARCH", garchOrder = c(1, 1)),
                   mean.model = list(armaOrder = c(2, 2), include.mean = FALSE, external.regressors = matrix(train_data_core[, "FINsentiment3"], ncol = 1)),
                   distribution.model = "norm")
arimax_garch_forecasts <- numeric(nrow(test_data_core))

for(i in 1:nrow(test_data_core)) {
    current_train_data <- fin_zoo4[1:(split_index + i - 1), ]
    current_train_data_core <- coredata(current_train_data)

    if(i > 1) {
        xreg_train <- matrix(current_train_data_core[, "FINsentiment3"], ncol = 1)
        xreg_forecast <- matrix(test_data_core[i - 1, "FINsentiment3"], ncol = 1)

        spec <- ugarchspec(variance.model = list(model = "sGARCH", garchOrder = c(1, 1)),
                           mean.model = list(armaOrder = c(2, 2), include.mean = FALSE, external.regressors = xreg_train),
                           distribution.model = "norm")
        model <- ugarchfit(spec = spec, data = current_train_data_core[, "OMXdaily_return3"])
        forecast_info <- ugarchforecast(model, xreg = xreg_forecast, n.ahead = 1)
        forecast_mean <- forecast_info@forecast$seriesFor
        arimax_garch_forecasts[i] <- as.numeric(forecast_mean)
    }
}

# Calculate and Compare Metrics for Both Models
calculate_metrics <- function(forecasts, actuals) {
    errors <- forecasts - actuals
    # Exclude the first forecast
    errors <- errors[-1]
    actuals <- actuals[-1]
    list(
        RMSE = sqrt(mean(errors^2)),
        MAPE = mean(abs(errors) / abs(actuals)) * 100,
        SMAPE = mean(2 * abs(errors) / (abs(actuals) + abs(forecasts[-1]))) * 100,
        MedAE = median(abs(errors))
    )
}


arimax_garch_metrics <- calculate_metrics(arimax_garch_forecasts, test_data_core[, "OMXdaily_return3"])
random_walk_metrics <- calculate_metrics(random_walk_forecasts, test_data_core[, "OMXdaily_return3"])

# Print the metrics
cat("ARIMAX-GARCH Model Metrics:\n")
print(arimax_garch_metrics)
cat("\nRandom Walk Model Metrics:\n")
print(random_walk_metrics)

# Comparison table
actual_values <- test_data_core[, "OMXdaily_return3"]
comparison_df <- data.frame(Forecast = arimax_garch_forecasts, RandomWalk = random_walk_forecasts, Actual = actual_values)
print(comparison_df)

# Plotting forecasts and actual values without the first observation
plot_forecasts <- function(actuals, forecasts1, forecasts2, title) {
    plot(actuals[-1], type = "l", col = "blue", ylim = range(c(actuals[-1], forecasts1[-1], forecasts2[-1])),
         main = title, xlab = "Date", ylab = "Price/Returns")
    lines(forecasts1[-1], col = "red")
    lines(forecasts2[-1], col = "green")
    legend("topleft", legend = c("Actual", "ARIMAX-GARCH", "Random Walk"),
           col = c("blue", "red", "green"), lty = 1)
}

# Plot the forecasts and actual values without the first observation
plot_forecasts(test_data_core[-1, "OMXdaily_return3"], arimax_garch_forecasts[-1], random_walk_forecasts[-1], "ARIMAX-GARCH vs Random Walk Forecast")
```

