2
$\begingroup$

I am trying to find the point where the slope of my data changes significantly. I want to determine a single point (in this case a value for days) in order to use it as an argument in a model I try to run.

study_data <- data.frame(days = c(30,50,100,133,166,200,233,266,300,333,366,400,450,500,750) ,
                 participants = c(100,85,60,45,36,30,27,23,21,19,19,17,16,16,6))

plot(study_data$days, study_data$participants)

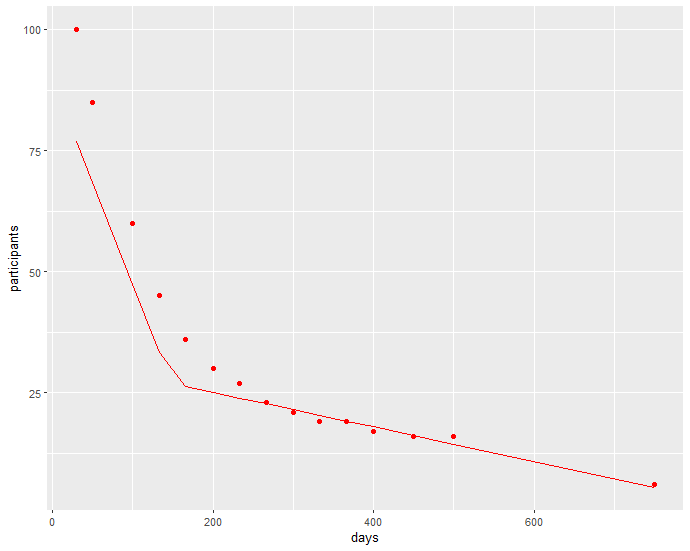
using the cpop package gave me multiple points of change.

result <- cpop(study_data$participants, study_data$days)
summary(result)
plot(result)

cpop package output

using the segmented package I get the following

nodes_model <- lm(participants ~ days, data = study_data)
segmented_nodes_model <- segmented(nodes_model, seg.Z = ~days)
nodes_breaks <- segmented_nodes_model$psi
          Initial     Est.   St.Err
psi1.days      NA 175.7564 6.215544

Both outputs don't really line up. I am sorry, but I am confused.

segmented output

$\endgroup$
4
  • $\begingroup$ What if it changes significantly at more than one place? $\endgroup$
    – jbowman
    Commented Apr 24 at 2:47
  • $\begingroup$ That's a good question. I am not really sure, how I could use that information. I got the segmented package to work (see code in the question) could I use the est. value? $\endgroup$
    – User108
    Commented Apr 24 at 3:32
  • 1
    $\begingroup$ What if it is changing everywhere, as it appears? Seeking a statistical test result to justify some sort of conclusion about particular point on the slope seems unlikely to yield a good outcome. What are the data and what would you really like to know about it? $\endgroup$ Commented Apr 24 at 4:52
  • $\begingroup$ The data doesn't look like there are any breakpoints up to 500 days. It rather seems like you have a non-linear relationship. $\endgroup$
    – Roland
    Commented Apr 25 at 5:19

1 Answer 1

8
$\begingroup$

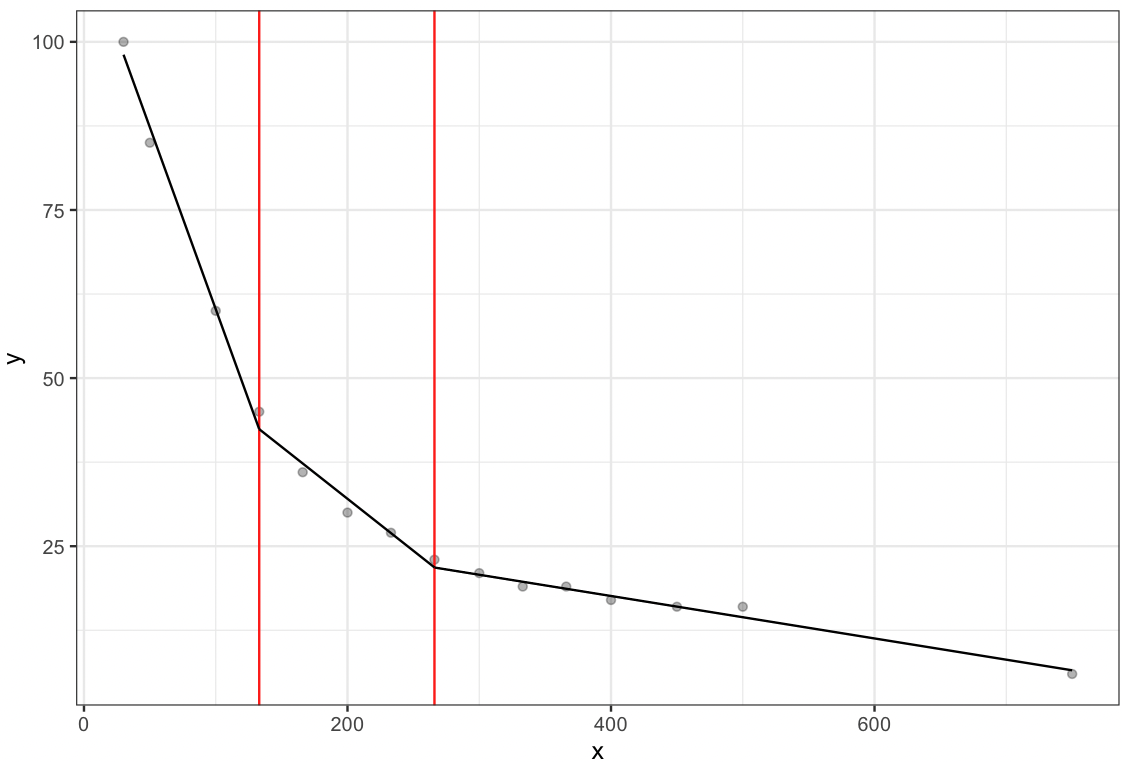
It appears that your version cpop does not respect the inhomogeneous grid in days. It should, and for me the latest version does:

enter image description here

Try updating the cpop package.

Also, the cpop method has a tuning parameter beta. This is beta = 2 * log(length(y)) by default, but the authors suggest to vary this and look at the resulting segmentations:

If we know, or have a good estimate of, the residual variances, and the noise is (close to) independent over time then an appropriate choice for the penalty is β = 2 log n, and this is the default for CPOP. However in many applications these assumptions will not hold and it is advised to look at segmentations for different value of β – this is possible using CPOP with the CROPS algorithm cpop.crops. Larger values of β will lead to functions with fewer changes.

source, see bottom of page 4.

Have you tried using the cpop.crops method?

$\endgroup$

Your Answer

By clicking “Post Your Answer”, you agree to our terms of service and acknowledge you have read our privacy policy.

Not the answer you're looking for? Browse other questions tagged or ask your own question.