3
$\begingroup$

Given the following data:

972, 975, 985, 993, 993, 995, 998, 1001, 1004, 1007, 1008, 1009, 1011, 1015, 1016, 1020, 1022, 1032

I calculate the lower quartile as follows:

Number of values: 18, Number of 'gaps': 17.

Lower quartile is at 17/4 + 1 = 5.25th value. 5.25th value is 993 + (995 - 993) x 0.25 = 993.5

Upper quartile is at 3 x 17/4 + 1 = 13.75th value. 13.75th value is 1011 + (1015 - 1011) x 0.75 = 1014

Both the Excel QUARTILE function and the R quantile function agree with me. However the book I am using (Understanding Statistics by Graham Upton and Ian Cook) give different answers (993 and 1015 respectively). I'm confused. Which is correct?

$\endgroup$
1
  • $\begingroup$ The correct one is the one that implements the definition in the book. How does this book define a quartile? $\endgroup$
    – whuber
    Commented Dec 6, 2016 at 22:37

2 Answers 2

2
$\begingroup$

As noted by Hyndman and Fan (1996) there are multiple definition of quantiles and different implementations, so it is very likely that you found different estimates calculated from the same data (each of them equally "correct"). I'm afraid that to mention all the differences I'd need to literally reproduce the paper in here, so maybe you should rather read it yourself, as it is available online:

Hyndman, R.J., & Fan, Y. (1996). Sample Quantiles in Statistical Packages. American Statistician, 50(4): 361-365.

Notice that quantile function for R (in fact implemented by Hyndman) enables you to calculate all the nine types of quantiles (using type parameter), check ?quantile to read more. So even R gave you only one of the possible estimates.

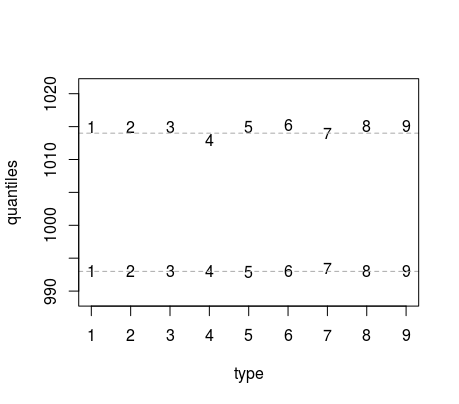
As about the estimates, types 1, 2, 3, 5, 6, 8, and 9 return the values reproduced in your book, type 7 (default in quantile function for R) is what you obtained and type 4 disagrees with both estimates.

Estimates of quantiles using different methods

$\endgroup$
5
  • $\begingroup$ Thank you for this resource. I didn't know that there so many. $\endgroup$
    – user140401
    Commented Dec 6, 2016 at 22:40
  • $\begingroup$ The formula for quantiles given in the book is rn/q + 1/2 where n is the number of observations, r is the rth quantile and q is the number of quantiles. So to calculate the 25th percentile of 10 observations would be 25x10/100 + 1/2 which is the 3rd observation. If I sketch this out on paper it seems reasonable I suppose. However, what I am having trouble with is that this formula gives the 100th percentile as the 10.5th observation. This just doesn't make sense to me. $\endgroup$
    – fractor
    Commented Dec 7, 2016 at 20:51
  • $\begingroup$ @fractor but the authors also mention that interpolation may be needed (as I checked in the Google books copy: books.google.pl/…) $\endgroup$
    – Tim
    Commented Dec 7, 2016 at 22:36
  • $\begingroup$ @Tim So I should extrapolate off the end? This would make the 100th percentile of the data (1, 2) evaluate to 2.5 and the 0th percentile evaluate to 0.5. It is symmetric and seems like something I can get my head around I guess. It just seems odd that the 0th and 100th percentiles may lie outside of the range of the data. $\endgroup$
    – fractor
    Commented Dec 8, 2016 at 12:19
  • $\begingroup$ @fractor I do not own the book and cannot argue for the author or check what did he write (except the Google excerpts). As I said, you can find review in the paper by Hyndman and Fan; there are different approaches to calculating quantiles that employ different solutions for such problems, like rounding or interpolating. I do not think that there is any point with arguing if the approach is "right" or "wrong", simply they used such definition, what you can argue is how consistent is it with the six postulates defined in the paper. $\endgroup$
    – Tim
    Commented Dec 8, 2016 at 13:36
0
$\begingroup$

There might be several ways to compute quartiles. One of the methods is your way, I am pretty sure that R and Excel using the way that you've used. This is the defaul type = 7 in R

However, another way of computing quartile is using the formula: Ly = (n+1)y/100 Ly is the location of the yth percentile (As all the quantile can be transformed into percentile), n is the number of observations. Using the second method the first quartile will be 25th percentile and Ly = (18+1)25/100 = 4.75 which took 4th value 993 and plus 0.75(5th - 4th) = 0.75(993-993) = 0 --> first quartile is 993.

This method is used by CFA Institute and in R is type = 6. I was confused at first but now I think I need to be flexible lol :D

$\endgroup$

Your Answer

By clicking “Post Your Answer”, you agree to our terms of service and acknowledge you have read our privacy policy.

Not the answer you're looking for? Browse other questions tagged or ask your own question.