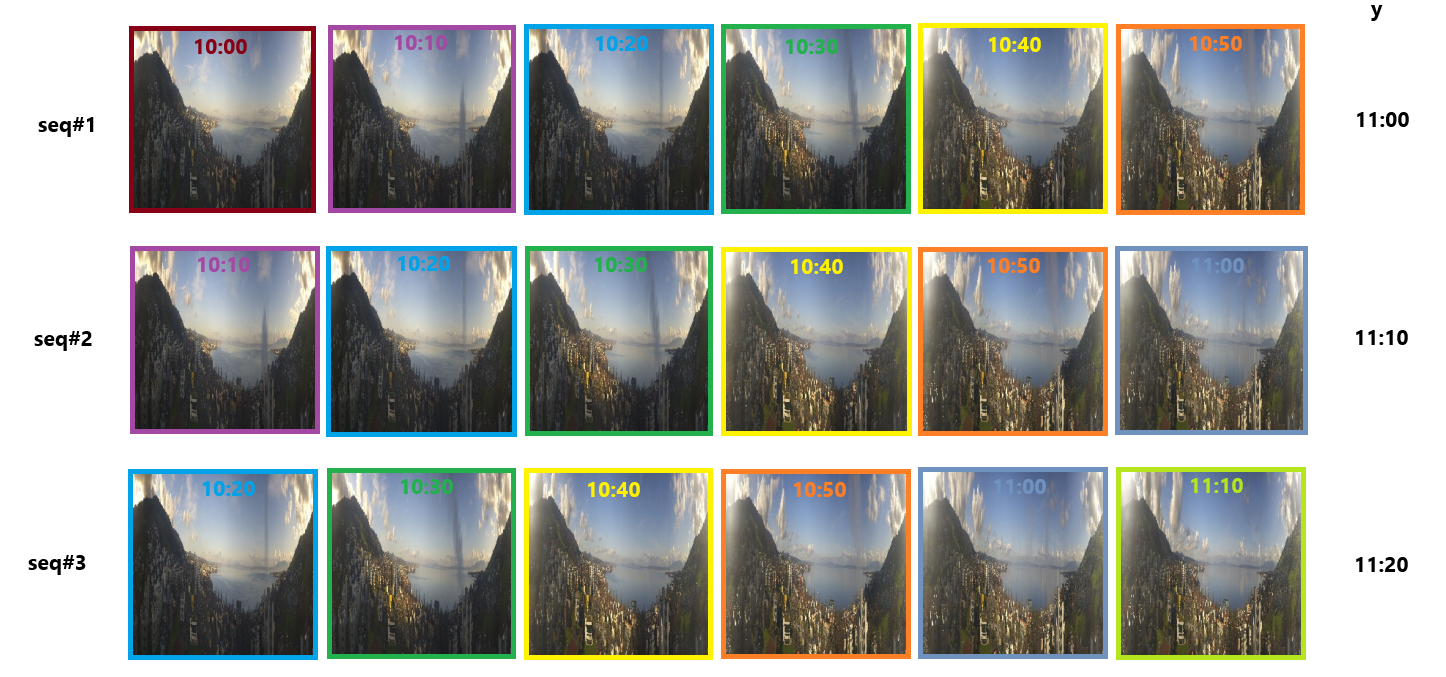
I am working on a predictive model for solar power production based on image sequences captured at 10-minute intervals. A single example my model receives as input consists of a sequence of images. My architecture combines CNNs and LSTMs, the CNN processes the image sequence to extract features, which are then passed to the LSTM to make use of the temporal information from the image sequence.
I am using a 10 min forecast interval, with images in 10 min resolution. Hence, each image (except for first few and last few) will occur in multiple sequences. Example of an input batch:

I am wondering whether shuffling the training data (i.e., shuffling the overall order of the image sequences, not the images within a sequence) during training can cause information leakage. My concern is that during training, the model might already have seen "future" images while predicting the "current" target, which could violate the temporal structure of the data. I don't provide any explicit timestamps or previous target values in the input, simply the image sequences.
By shuffling, I am hoping for better gradient updates and better batch normalization.
Edit:
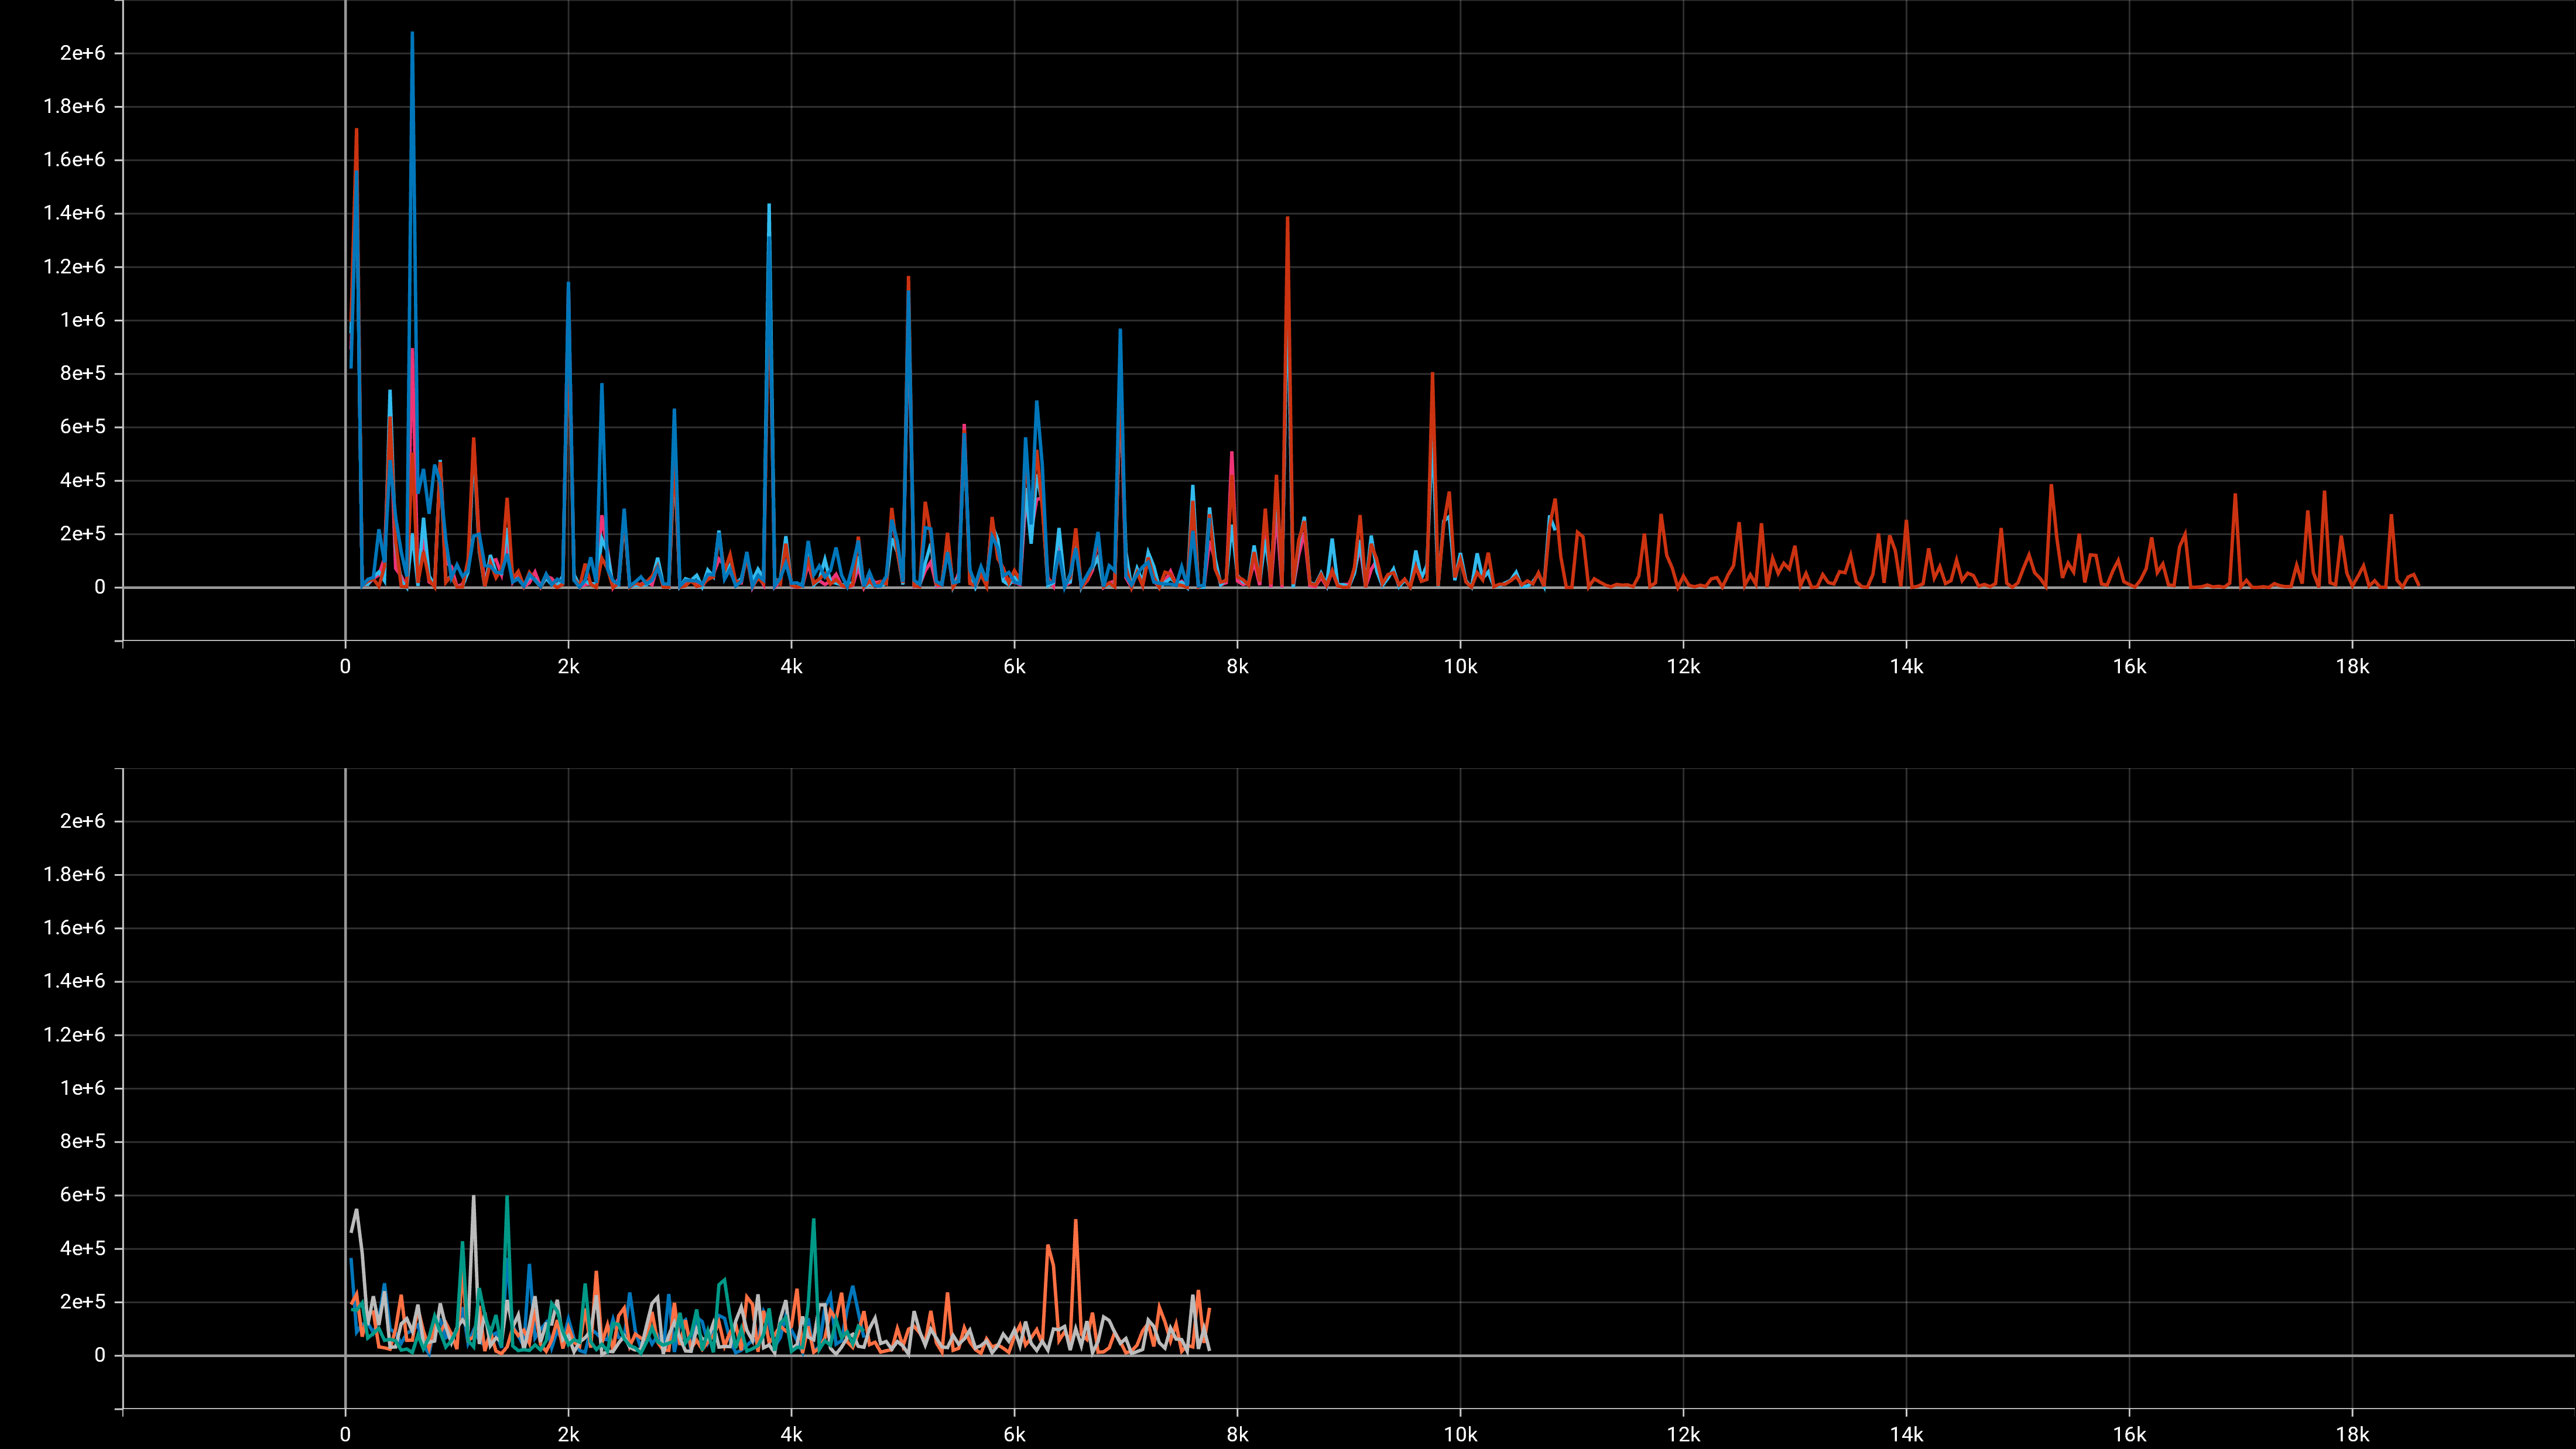
The plots below show the training (MSE) loss. The upper plot represents results without shuffling, while the lower plot includes shuffling. Each plot includes four independent runs to account for variations due to initialization.
 Early stopping with a patience of 2 epochs was applied based on the validation loss, resulting in varying run lengths.
