5
$\begingroup$

I have the following specific needs for a field trial and would like to generate a design after understanding its treatment and unit structures. There are,

  1. There are 40 genotypes/varieties. 10 genotypes each form a pre-assigned group, hence there are 4 groups of genotypes
  2. A group can be either of the two levels/categories -- two line and three line
  3. Genotypes are replicated in 3 complete replicates
  4. Each replicate is composed of 2 blocks
  5. Each block consists of 2 complete (containing all 10 genotypes) sub-block groups, one from both levels/categories
  6. Group assignment to a sub-block is random.
  7. Genotypes within each sub-block are randomized

With the details above, I have been able to generate exactly the required design in R using tidyverse functions and grouping structures.

v_df <- tibble(`Variety name` = paste0("V", 1:40), 
    `Space allocation` = rep(c("Three line", "Two line", "Two line", 
         "Three line"), each = 10)) %>%
  mutate(`Group` = rep(1:4, each = 10)) %>% 
  group_by(`Group`) %>% 
  nest() %>%
  expand_grid(replication = 1:3) %>% 
  arrange(replication) %>% 
  mutate(block = rep(1:6, each = 2)) %>% 
  group_by(block) %>% 
  mutate(`data` = sample(data, 2, replace = FALSE)) %>%
  ungroup() %>% 
  mutate(genotype = purrr::map(data, ~sample_n(.x, size = 10, 
         replace = FALSE))) %>% 
  select(-data) %>% 
  unnest_longer(genotype) %>% 
  unpack(cols = genotype) %>% 
  group_by(replication, block) %>% 
  mutate(x = row_number()) %>% 
  ungroup() %>% 
  mutate(y = as.numeric(interaction(replication, block))) %>% 
  mutate(Group = as.factor(Group))

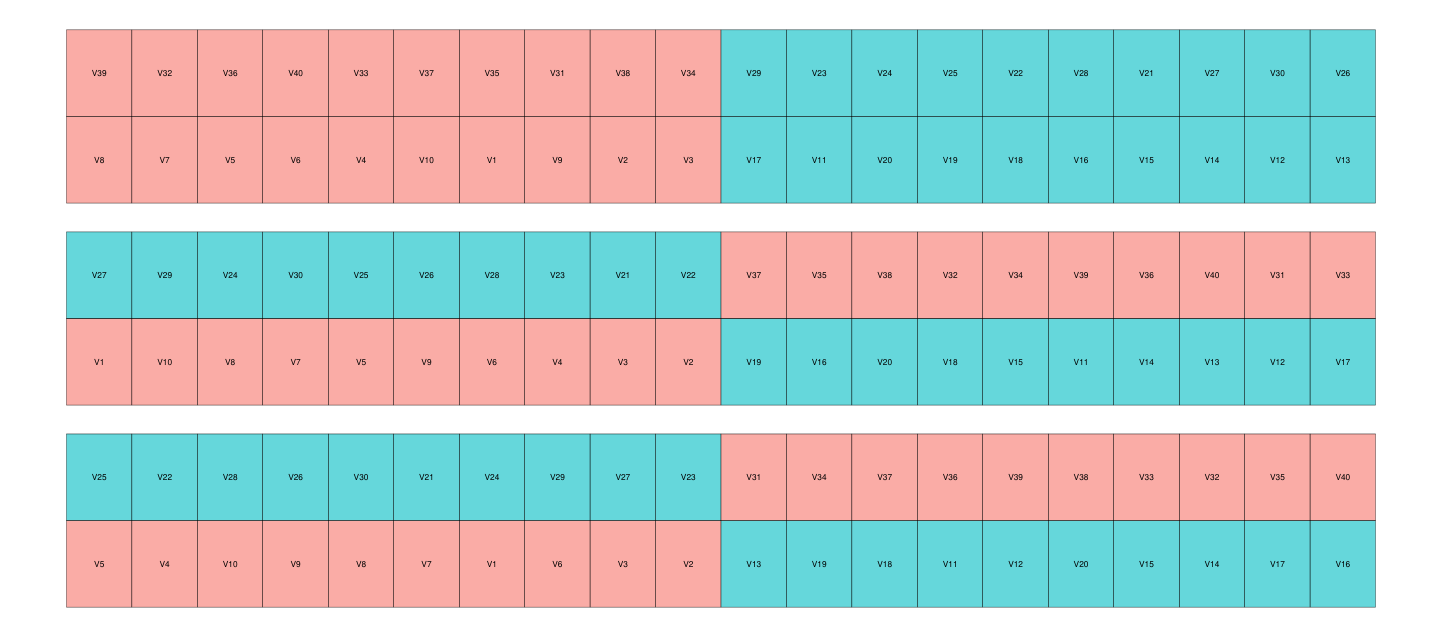
This produces following layout graph (graphing code is included at bottom of this post):

Experimental design's layout

I can glean that replicates are complete and confined in blocks. So no problem saying it is an RCBD. But, what about sub-blocks ? Allocating them within blocks and replicate with a specific grouping structure eludes my understanding of the design and the theory.

What pokes me is, whether this is a valid design or not, in the first place. And if it is then, what category of design does it fit into ? I hope to know better the usage of this and similar kind of designs.

Since the design imposes constrains in blocking, I would guess certain r packages/functions already implement the feature more efficiently than my verbose code. It would be helpful to have code pointers in answer.

# Graphing code
ggplot() +
  geom_tile(data = v_df, aes(x, y, fill = `Space allocation`),
            color = NA, linewidth=1.2, alpha = 0.6) +
  scale_fill_discrete() +
  geom_tile(data = v_df, aes(x = x, y = y),
            color = "black", fill = NA) +
  geom_text(data = v_df, aes(x = x, y = y,
               label = stringr::str_wrap(`Variety name`, width = 8)), 
                      size = 1.85) +
  guides(fill = "none") +
  theme_void()
$\endgroup$
3
  • $\begingroup$ Can you explain, what do you mean by group and levels? are they properties of the genotypes themselves (like family, origin, history, collection) or they are treatment factors? It is important to know as they determine what kind of design would be best to conduct depending also on the facilities and running costs. $\endgroup$
    – SAL
    Commented Dec 10 at 10:03
  • $\begingroup$ In fact, group belongingness of a genotype is not related to its nature. Differing groups represent different quantities of the genotypes' seed available for testing, so I assume it may be thought of as treatment factor as groups of genotypes will be sown at different planting densities. $\endgroup$
    – dd_rookie
    Commented Dec 11 at 1:14
  • $\begingroup$ In your within group (two levels/categories -- two line and three line), do you mean sowing densities of planting either in two rows or three rows? $\endgroup$
    – SAL
    Commented Dec 11 at 19:57

1 Answer 1

1
$\begingroup$

The design you have generated resembles specific type of factorial designs and could be considered as split-plot design. Generally, full factorial designs are preferred over split-plot designs if there is no issue from both practical and agronomical point of views. Based on the information, in my opinion there are actually two factors varying in your experiment: Variety (40 levels) and spacing allocation (two levels). This is because half of genotypes are assigned to the Two-row level and half are assigned to Three-row level of space allocation.

Note that, factorial designs are easy to analyze as there is only one experimental error given one has a single level of randomization of the treatment combinations between the levels of various factors to the experimental units (here 40*2 treatments randomly assigned to plots in each replicate or complete block). However, in the case of your experiment this type of randomization would be inappropriate depending on your factor (spacing allocation) with the constraints imposed by limited resources of seed. On the other hand, if you conduct a full factorial experiment, a plot with Two- row level could be randomly allocated between plots assigned to Three-row spacing level. This could also resulted in more error either due to some competitions (e.g, light perception, ..) or practical management.

Therefore, you might be forced to conduct your experiment as split-plot design to have different randomizations and therefore unequal size of experimental units and perform randomization at different levels (e.g, randomization between levels of space allocation and between varieties within each space allocation) to overcome logistical and/or technological constraints of your experiment. With the aforementioned explanation, you would have two randomization steps, one for the groups or whole-plots within each replicate and second for varieties within each whole plot or sub-plots.

I would say to proceed as follows:

  1. In the first step, divide the 20 varieties from each spacing allocation into two equal group of 10 varieties. The 10 varieties with the same spacing allocation form a whole-plot or an incomplete block within each replicate. If the replicate should be as what you have shown in the generated figure, then each replicate would be splitted into 4 whole-plots and assigned randomly to your groups. Here, I would say assigning whole-plots like replicates 2 and 3 is preferred compared to the first one as you showed in the graph (i.e, both levels present at both side of replicates in order to prevent confounding of spacing with block effects).
  2. In the second step, randomly assign every 10 varieties with same spacing allocation to each of the 4 groups (whole-plots) which contain 10 sub-plots of equal size.

Note that whole-plots are incomplete blocks of size k=10 meaning that in your case all varieties cannot be compared with same precision because only subset of varieties are existing within each whole plot and comparisons between varieties within same incomplete block (whole-plot) is more precise compared to those between different whole plots or space allocations. The incomplete block design is within each of the whole-plot treatments (space allocation) rather than within each replicate or complete block. Then, there are b=4 incomplete blocks of size k=10 within a space allocation and within each replicate.

A combined analysis of the proposed experiment based on information above including sources of variation and their corresponding degrees of freedom would be as follows (Federer , 2007; page 75):


Replicate (R) = R-1

Spacing (S) = S-1

Error (S)= S*R = (S-1)(R-1)

Varieties within Spacing (V) = S (V-1)

Blocks within spacing within replicates = SR (B-1)

Error = S(RBK – RB – BK +1)


K = incomplete block size (10)

$\endgroup$

Your Answer

By clicking “Post Your Answer”, you agree to our terms of service and acknowledge you have read our privacy policy.

Not the answer you're looking for? Browse other questions tagged or ask your own question.