18
$\begingroup$

I am hoping that I can ask this question the correct way. I have access to play-by-play data, so it's more of an issue with best approach and constructing the data properly.

What I am looking to do is to calculate the probability of winning an NHL game given the score and time remaining in regulation. I figure I could use a logistic regression, but I am not sure what the dataset should look like. Would I have multiple observations per game and for every slice of time I am interested in? Would I have one observation per game and fit seperate models per slice of time? Is logisitic regression even the right way to go?

Any help you can provide will be very much appreciated!

Best regards.

$\endgroup$
3
  • $\begingroup$ Tough question! My guess is that it would help to know more than I do about counting processes (and more than Wikipedia does: en.wikipedia.org/wiki/Counting_process ) $\endgroup$
    – onestop
    Commented Feb 1, 2011 at 9:30
  • $\begingroup$ Do you have access to the ASA journal Chance? Seems to me there was a relevant article appearing in the last year or so, whether about hockey or another sport. $\endgroup$
    – rolando2
    Commented Feb 2, 2011 at 4:33
  • $\begingroup$ I try to reformulate the problem (to stimulate discussion ?): Let's say we have a set of discrete states in a game (e.g. in tic-tac-toe). Now it is reasonable to create one model per state (maybe using logistic regression) to predict the outcome. Now HERE we have also a game, but with continuous states (i.e. game time). The question now of the OP is: How to a) discretize the time into finite set states or b) how to build a model whose parameters vary depending(!) on the current game-time. There must be someone who has already solved this "general" problem. $\endgroup$
    – steffen
    Commented Feb 2, 2011 at 11:08

3 Answers 3

9
+25
$\begingroup$

Do a logistic regression with covariates "play time" and "goals(home team) - goals(away team)". You will need an interaction effect of these terms since a 2 goal lead at half-time will have a much smaller effect than a 2 goal lead with only 1 minute left. Your response is "victory (home team)".

Don't just assume linearity for this, fit a smoothly varying coefficient model for the effect of "goals(home team) - goals(away team)", e.g. in R you could use mgcv's gam function with a model formula like win_home ~ s(time_remaining, by=lead_home). Make lead_home into a factor, so that you get a different effect of time_remaining for every value of lead_home.

I would create multiple observations per game, one for every slice of time you are interested in.

$\endgroup$
4
  • $\begingroup$ Great! Thanks for the help. I was going to use R, and was going to setup the data similar to how you suggested, interaction effects and all. Glad to see I was on the right track, and I do really appreicate your time. $\endgroup$
    – Btibert3
    Commented Feb 3, 2011 at 14:53
  • 1
    $\begingroup$ Be careful with the non-independence generated by including multiple time-slices. A random effects (multi-level) model could help. $\endgroup$ Commented Feb 4, 2011 at 11:52
  • 1
    $\begingroup$ @ Eduardo: I agree that the dependence is not modelled and that this is somewhat problematic, thanks for pointing it out. I'm not sure how random effects would help -- since the binary outcome win_home is constant at the level of grouping (i.e. for all time slices for any given match it's either 0 or 1), including, e.g. a random intercept, for the matches will just result in huge problems with separation in this context. $\endgroup$
    – fabians
    Commented Feb 4, 2011 at 14:44
  • $\begingroup$ You might also want to consider including a parameter for total goals scored, as leads tend to be given away more easily in high scoring games. $\endgroup$
    – James
    Commented Feb 4, 2011 at 14:51
6
$\begingroup$

I would start simulating the data from a toy model. Something like:

n.games <- 1000
n.slices <- 90

score.away <- score.home <- matrix(0, ncol=n.slices, nrow=n.games)

for (j in 2:n.slices) {
  score.home[ ,j] <- score.home[ , j-1] + (runif(n.games)>.97)
  score.away[ ,j] <- score.away[ , j-1] + (runif(n.games)>.98)
}

Now we have something to play with. You could also use the raw data, but I find simulating the data very helpful to think things through.

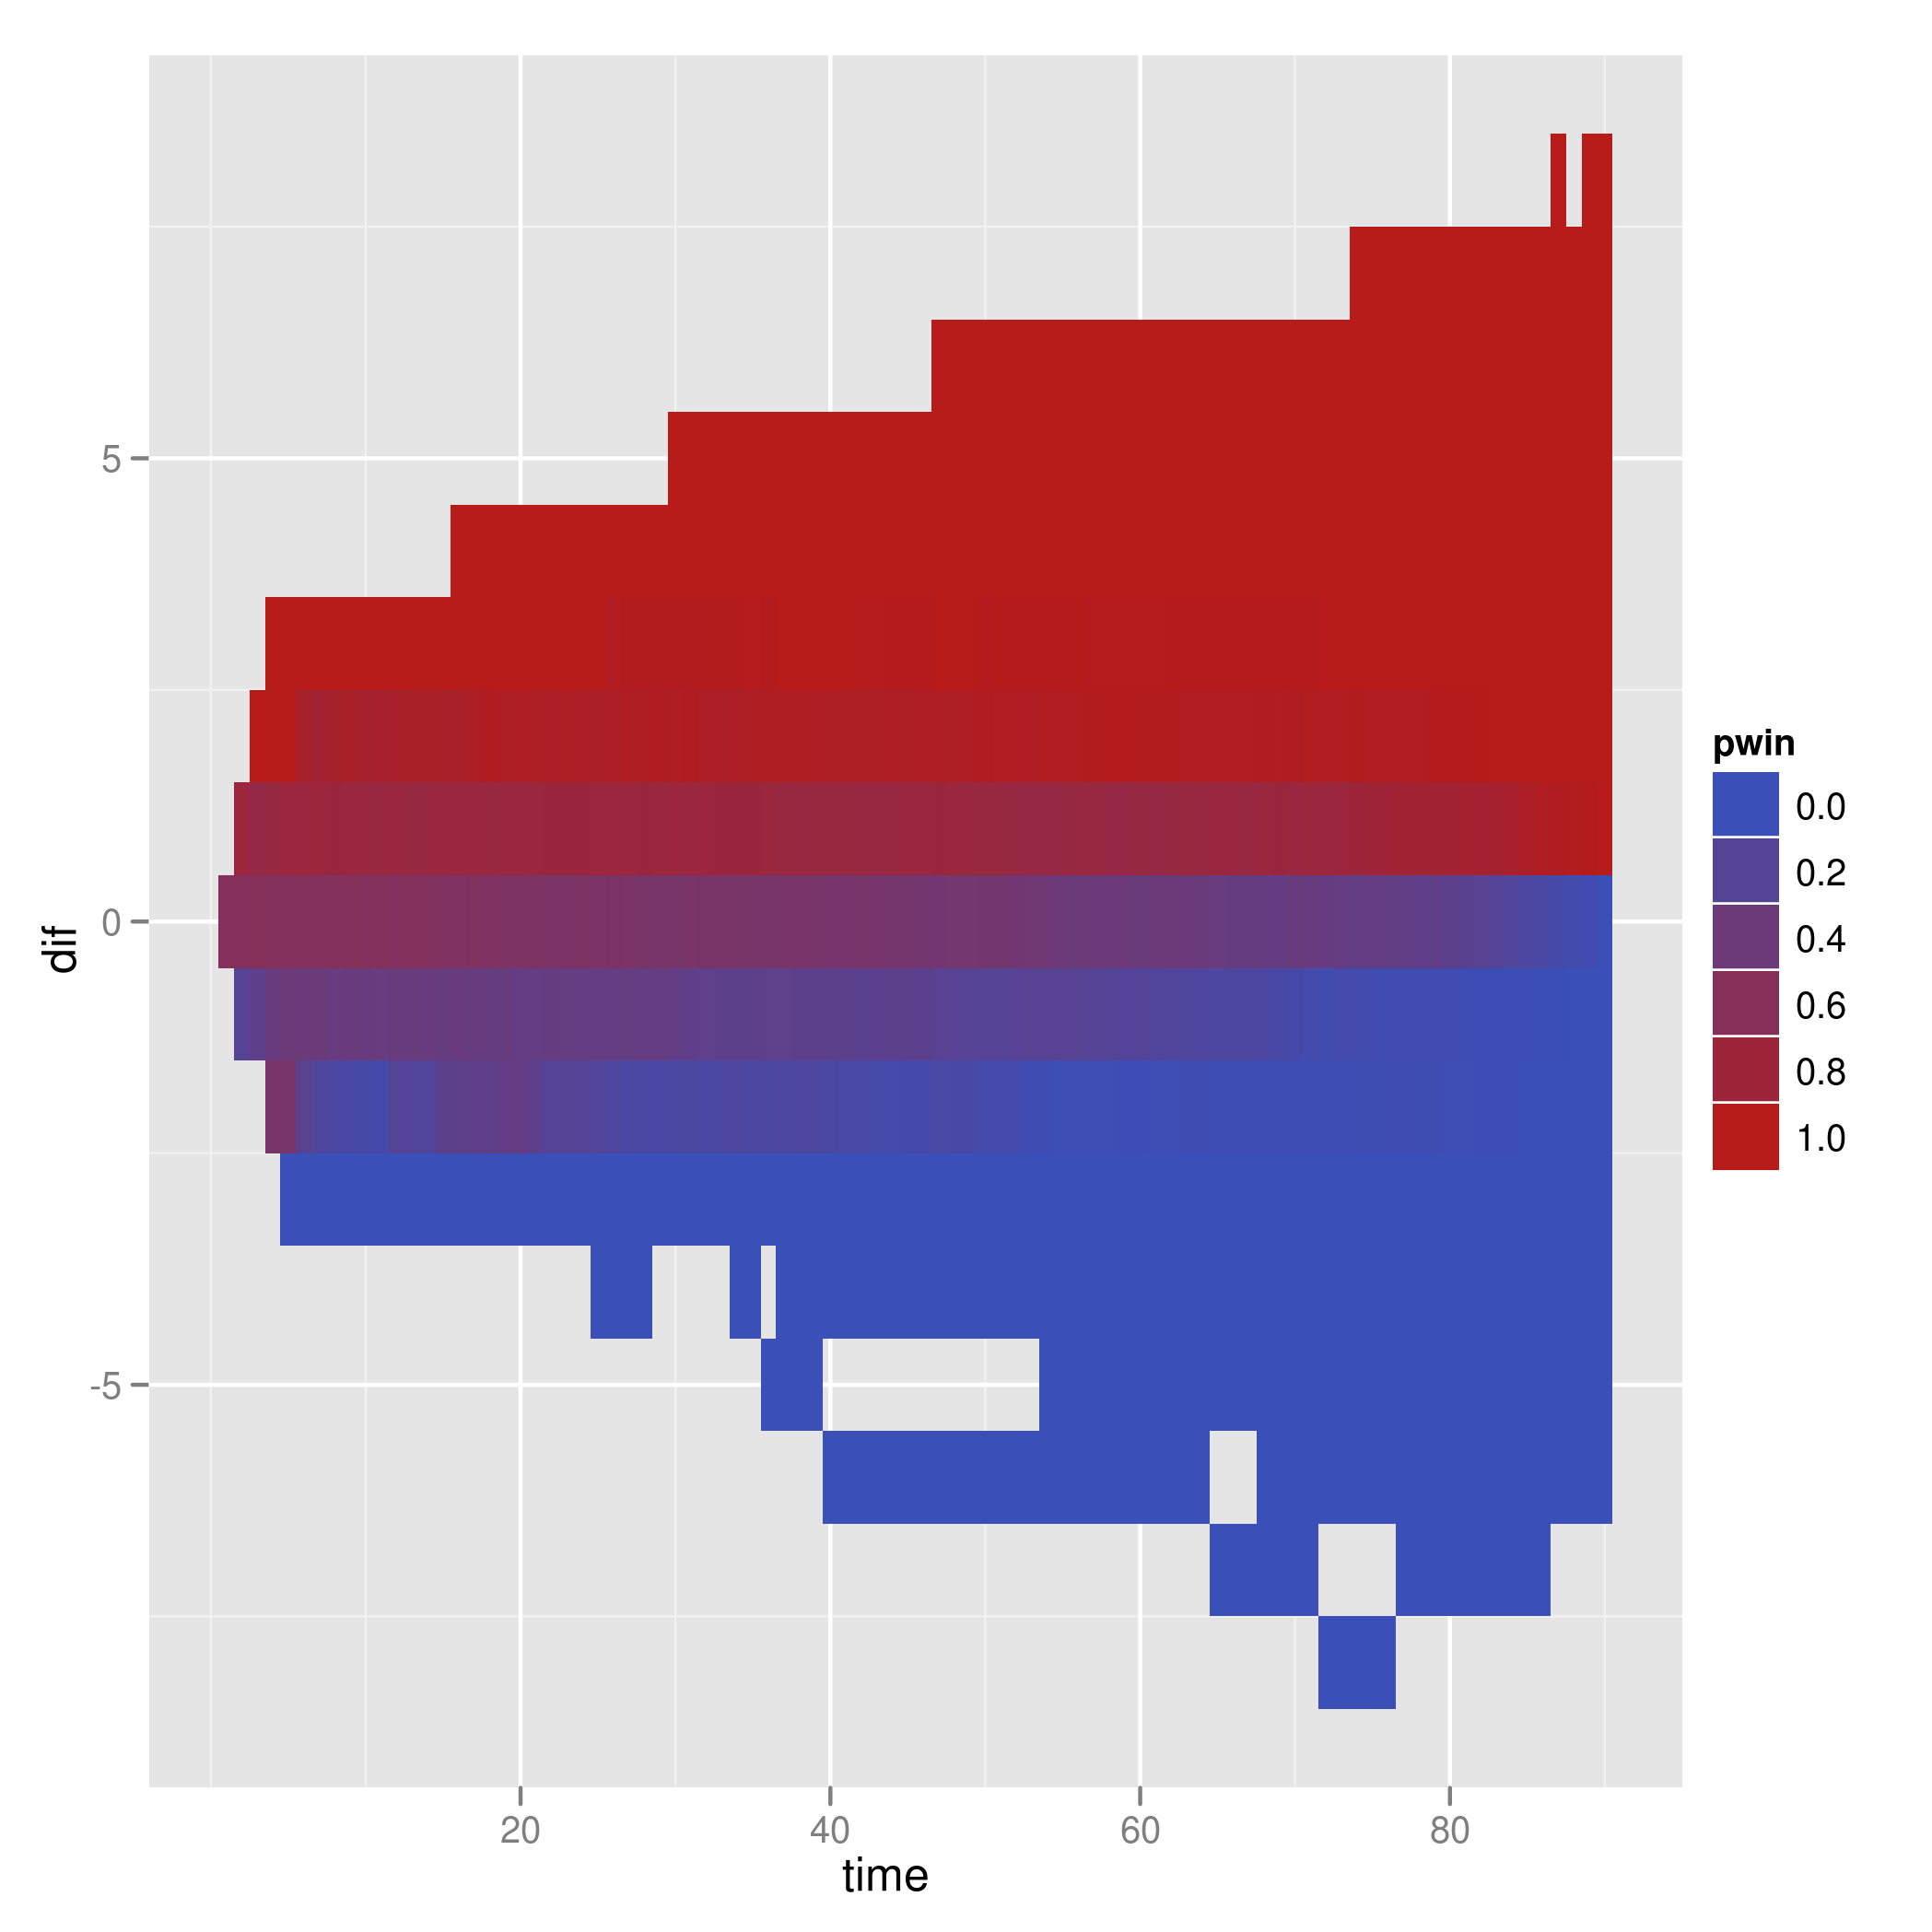
Next I would just plot the data, that is, plot time of the game versus lead home, with the color scale corresponding to the observed probability of winning.

score.dif <- score.home-score.away

windf <- data.frame(game=1:n.games, win=score.home[ , n.slices] > score.away[, n.slices])

library(reshape)
library(ggplot2)

dnow <- melt(score.dif)
names(dnow) <- c('game', 'time', 'dif')
dnow <- merge(dnow, windf)

res <- ddply(dnow, c('time', 'dif'), function(x) c(pwin=sum(x$win)/nrow(x)))

qplot(time, dif, fill=pwin, data=res, geom='tile') + scale_color_gradient2() 

This will help you find the support of your data, and give you a raw idea of what the probabilities look like.

Plot

$\endgroup$
1
$\begingroup$

Check out the stats nerds at Football Outsiders as well as the book Mathletics for some inspiration.

The Football Outsiders guys make game predictions based on every play in a football game.

Winston in Mathletics uses some techniques such as dynamic programming as well.

You can also consider other algorithms such as SVM.

$\endgroup$

Your Answer

By clicking “Post Your Answer”, you agree to our terms of service and acknowledge you have read our privacy policy.

Not the answer you're looking for? Browse other questions tagged or ask your own question.