I ran an OLS regression model on data set with 5 independent variables. The independent variables and dependent variable are both continuous and are linearly related. The R Square is about 99.3%. But when I run the same using random forest in R my result is '% Var explained: 88.42'. Why would random forest result be so inferior to regression? My assumption was that random forest would be at least as good as OLS regression.
-
4$\begingroup$ If your goal is to predict, a higher R-square may be due to overfitting. Try to compare the RN predictions with Regression predictions using cross-validation. $\endgroup$– Manoel GaldinoCommented Aug 7, 2013 at 18:19
-
$\begingroup$ This happened because you put this in the data yourself. You seem to have generated the data yourself, because you know the true model. Then you fitted the models yourself, and evaluated R2. What is the sample size? What parameters and function were used to fit the RF? Is the variance explained on training or test data? A reproducible example is needed. $\endgroup$– Marjolein FokkemaCommented Feb 24, 2021 at 0:24
5 Answers
I don't know exactly what you did, so your source code would help me to guess less.
Many random forests are essentially windows within which the average is assumed to represent the system. It is an over-glorified CAR-tree.
Lets say you have a two-leaf CAR-tree. Your data will be split into two piles. The (constant) output of each pile will be its average.
Now lets do it 1000 times with random subsets of the data. You will still have discontinuous regions with outputs that are averages. The winner in a RF is the most frequent outcome. That only "Fuzzies" the border between categories.
Example of piecewise linear output of CART tree:
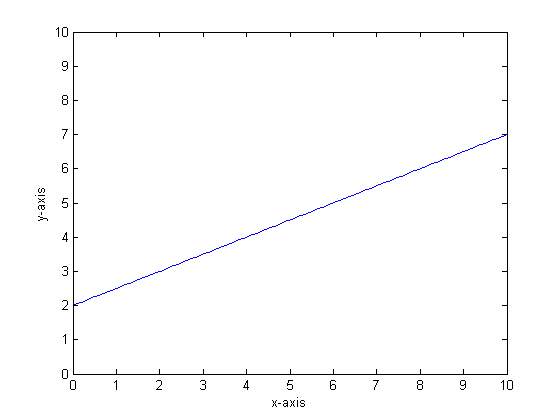
Let us say, for instance, that our function is y=0.5*x+2. A plot of that looks like the following:

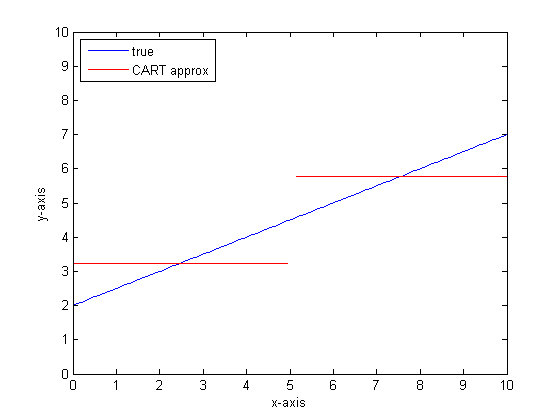
If we were to model this using a single classification tree with only two leaves then we would first find the point of best split, split at that point, and then approximate the function output at each leaf as the average output over the leaf.

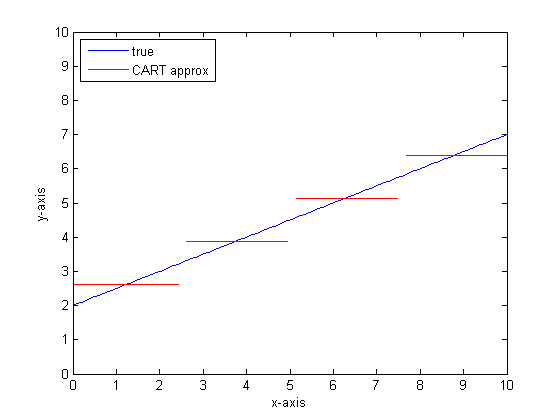
If we were to do this again with more leaves on the CART tree then we might get the following:

Why CAR-forests?
You can see that, in the limit of infinite leaves the CART tree would be an acceptable approximator.
The problem is that the real world is noisy. We like to think in means, but the world likes both the central tendency (mean) and the tendency of variation (std dev). There is noise.
The same thing that gives a CAR-tree its great strength, its ability to handle discontinuity, makes it vulnerable to modeling noise as if it were signal.
So Leo Breimann made a simple but powerful proposition: use Ensemble methods to make Classification and Regression trees robust. He takes random subsets (a cousin of bootstrap resampling) and uses them to train a forest of CAR-trees. When you ask a question of the forest, the whole forest speaks, and the most common answer is taken as the output. If you are dealing with numeric data, it can be useful to look at the expectation as the output.
So for the second plot, think about modeling using a random forest. Each tree will have a random subset of the data. That means that the location of the "best" split point will vary from tree to tree. If you were to make a plot of the output of the random forest, as you approach the discontinuity, first few branches will indicate a jump, then many. The mean value in that region will traverse a smooth sigmoid path. Bootstrapping is convolving with a Gaussian, and the Gaussian blur on that step function becomes a sigmoid.
Bottom lines:
You need a lot of branches per tree to get a good approximation to a very linear function.
There are many "dials" that you could change to impact the answer, and it is unlikely that you have set them all to the proper values.
References:
-
$\begingroup$ Isn't the RANDOM forest regression performed with piecewise constant functions, which is obviously a poor fit to linearly related data? $\endgroup$– seanv507Commented Aug 7, 2013 at 22:59
-
$\begingroup$ I think we are saying the same thing. Which constant is the one used? right. $\endgroup$ Commented Aug 8, 2013 at 11:35
-
$\begingroup$ If I thought we were saying the same thing I would have put it as a comment. I do not understand your answer. My answer explains that OPs data is linear and so badly fit by a piecewise constant function. $\endgroup$– seanv507Commented Aug 8, 2013 at 11:43
-
$\begingroup$ @seanv507 The benefit of the RF is that the multiple trees, fit to (random subsets of) perturbed versions of the data, average out the discontinuities. The result is a better approximation to the underlying smooth line than what a single tree would produce. $\endgroup$– Hong OoiCommented Aug 8, 2013 at 19:54
-
$\begingroup$ It is essentially bootstrap resampling on a regression tree. One of the things that I don't like about bootstrap is that the uniform distribution counts as an informative prior. Isn't the ideal case a non-informative prior? $\endgroup$ Commented Aug 9, 2013 at 13:02
I notice that this is an old question, but I think more should be added. As @Manoel Galdino said in the comments, usually you are interested in predictions on unseen data. But this question is about performance on the training data and the question is why does random forest perform badly on the training data? The answer highlights an interesting problem with bagged classifiers which has often caused me trouble: regression to the mean.
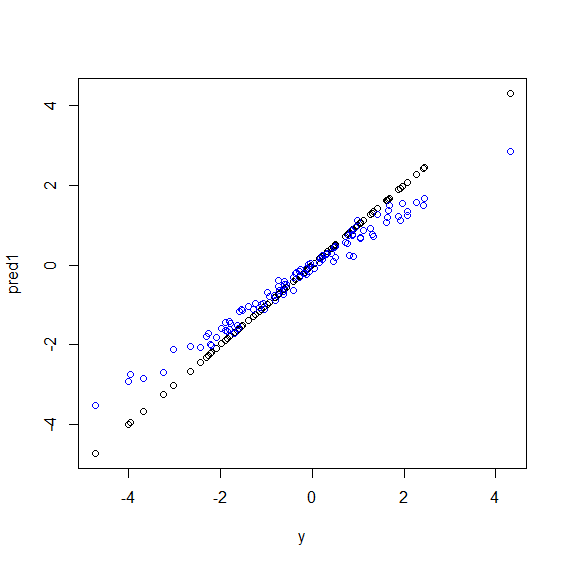
The problem is that bagged classifiers like random forest, which are made by taking bootstrap samples from your data set, tend to perform badly in the extremes. Because there is not much data in the extremes, they tend to get smoothed out.
In more detail, recall that a random forest for regression averages the predictions of a large number of classifiers. If you have a single point which is far from the others, many of the classifiers will not see it, and these will essentially be making an out-of-sample prediction, which might not be very good. In fact, these out-of-sample predictions will tend to pull the prediction for the data point towards the overall mean.
If you use a single decision tree, you won't have the same problem with extreme values, but the fitted regression won't be very linear either.
Here is an illustration in R. Some data is generated in which y is a perfect liner combination of five x variables. Then predictions are made with a linear model and a random forest. Then the values of y on the training data are plotted against the predictions. You can clearly see that random forest is doing badly in the extremes because data points with very large or very small values of y are rare.
You will see the same pattern for predictions on unseen data when random forests are used for regression. I am not sure how to avoid it. The randomForest function in R has a crude bias correction option corr.bias which uses linear regression on the bias, but it doesn't really work.
Suggestions are welcome!
beta <- runif(5)
x <- matrix(rnorm(500), nc=5)
y <- drop(x %*% beta)
dat <- data.frame(y=y, x1=x[,1], x2=x[,2], x3=x[,3], x4=x[,4], x5=x[,5])
model1 <- lm(y~., data=dat)
model2 <- randomForest(y ~., data=dat)
pred1 <- predict(model1 ,dat)
pred2 <- predict(model2 ,dat)
plot(y, pred1)
points(y, pred2, col="blue")
-
1$\begingroup$ I agree with your observation, but I have become a fan of RF regression towards the mean in areas with few data points. Well if one was very sure to find a nice overall linear structure all the way to borderline of the training set only supported by few data points, then just make a linear correction and have RF take care of the residuals. $\endgroup$ Commented Dec 18, 2015 at 2:45
-
2$\begingroup$ Thanks for the comment! I had a nasty experience in which it was giving predictions that were very bad and which were making me look bad. But perhaps there is no way to get more accurate predictions for borderline points without increasing the variance. $\endgroup$ Commented Dec 18, 2015 at 3:47
-
1$\begingroup$ An additional comment years later, I've noticed that RF tends to perform poorly any where where there is a slight gap in the data. Of course, there is often less data at the extremes of a data set, but every once in a while you might end up with a gap right in the center. RF can make a right mess of a dataset with any gaps in it. $\endgroup$ Commented Jun 28, 2017 at 15:24
Random forest tries to find localities among lots of features and lots of data points. It splits the features and gives them to different trees, as you have low number of features the overall result is not as good as logistic regression. Random forest can handle numeric and categorical variables but is not good at handling missing values.
I think that Random Forest (RF) is a good tool when the functional form of the relation between Xs and y is complicated (because of nonlinear relations and interaction effect). RF categorizes Xs based on the best cutpoint (in term of minimum SSE) and doesn't apply the researcher information about the functional form of relationship. On the oothe hand, OLS regression use this information. In your example, you know what exactly is the type of relationship between Xs and y and use all of this information in your regression model but RF don't use this information.
For the basics, Regression perform well over continuous variables and Random Forest over discrete variables.
You need to provide more details about the problem and about the nature of the variables in order to be more specific...
-
$\begingroup$ All the variables daily returns of stocks (financial time series)... $\endgroup$ Commented Aug 7, 2013 at 16:55
-
3$\begingroup$ "Regression perform well over continuous variables and Random Forest over discrete variables.": This is not true in general. There are distinctions in inference and prediction, and even with prediction there are cases when regression would be preferred over RF. $\endgroup$– AdamOCommented Aug 7, 2013 at 19:37

