Just a follow-up on Simon's answer.
The Gini index (impurity index) for a node $c$ can be defined as:
$$ i_c = \sum_i f_i \cdot ( 1- f_i) = 1 - \sum_i f_i^2$$
where $f_i$ is the fraction of records which belong to class $i$.
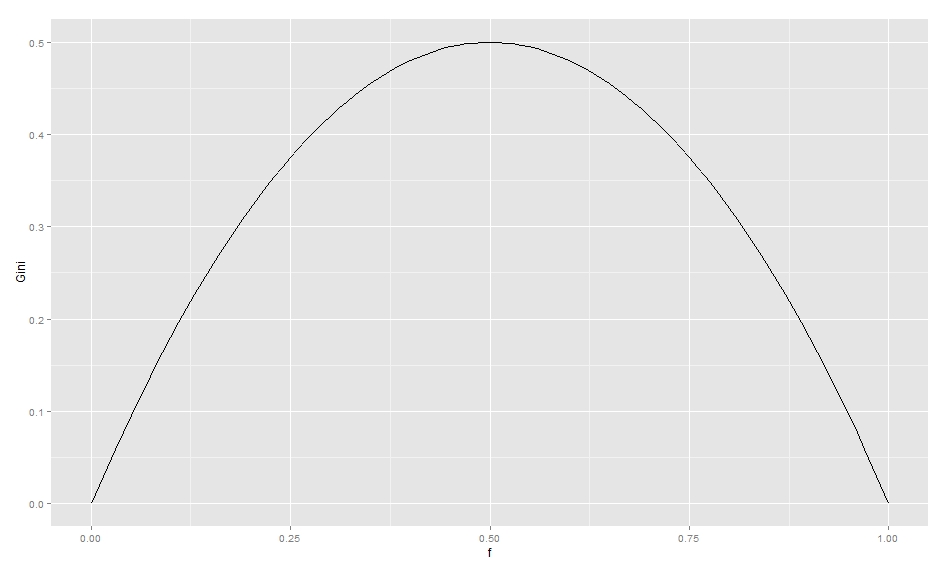
If we have a two class problem we can plot the Gini index varying the relative number of records of the first class $f$. That is $f_1 = f$ and $f_2 = f - f_1$.

We have very high impurity when the class distribution is uniform.
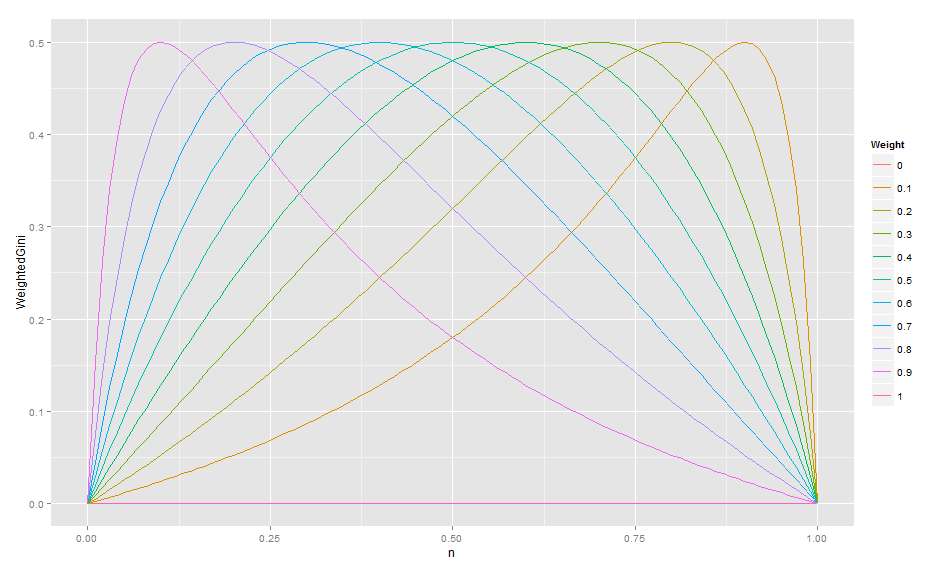
If we assign a weight to each class we are actually rebalancing the impurity index - a high weight for one class (say $\bar{i}$) leads to a stronger decrease of impurity when the number of records for that class increases. We will not have the maximum impurity when the class distribution is uniform anymore. Just a small amount of records in $\bar{i}$ will be enough to decrease the node impurity.
We can still sketch a two class problem example. In Simon's formulas our $f_i$s are
$$f_i = \frac{w_i \cdot n_i}{\sum_i w_i \cdot n_i}$$
We can see that the formula does not change if $\sum_i n_i = 1$ and $\sum_i w_i = 1$ (it is enough to multiply numerator and denominator by the total number of records and total weight). Let $f$ be
$$f = \frac{w \cdot n}{w \cdot n + (1-w)(1-n)}$$
where $n$ is the relative number of records for the first class and $w$ their weight. Now we could compute the Gini when we vary the relative number of records for the first class $n$.

For example if we choose a weight of $0.9$ we have maximum impurity when $n \approx 0.1$. If $n$ increases the impurity steeply decreases as well.
If we define the weigthed Gini index as the OP did we would for example have a strange behaviour in a two class problem:
$$\sum_i w_i \cdot f_i \cdot (1 - f_i) = w \cdot f \cdot (1 - f) + (1 - w) \cdot (1-f) \cdot f = f \cdot ( 1- f)$$
However, I found a paper that uses that index here but I didn't read it, so I might be wrong.
Breiman's weighted index makes actually sense - we are trying to reweight the classes in a cost-sensitive way. The same approach is used in the MetaCost classifier implemented in WEKA.
In case anyone is interested, this is the R code I used to plot the figures:
require(ggplot2)

# two class probability distribution
f <- seq(0,1,0.01)

# Standard Gini impurity
# f1 = f and f2 = 1 - f
Gini <- f*(1-f) + (1-f)*f
qplot(f,Gini, geom = "path")

# Weighted Gini impurity
w <- seq(0,1,0.1)
w_ <- as.vector( sapply(w, function(x) rep(x,length(f))))
n <- rep(f,length(w))

f <- w_*n / ( w_*n + (1-w_)*(1-n) )
WeightedGini <- f*(1-f) + (1-f)*f

Weight <- as.factor(w_)
qplot(n, WeightedGini, colour = Weight, geom = "path")


