9
$\begingroup$

Is it possible to plot a partial dependency plot to display the class probability and estimate the effects of a predictor for a GBM model? Something similar to partialPlot from randomForest package.
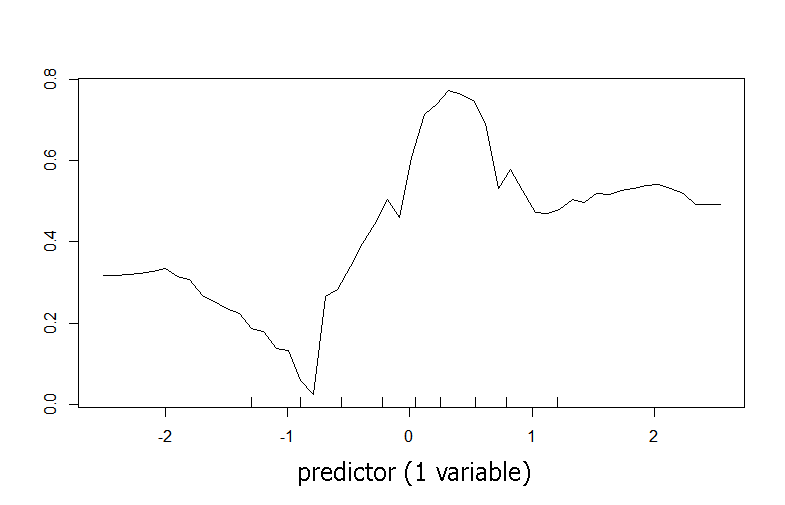
enter image description here

According to this article, a partial plot is doable with gbm.

Thanks in advance for your help.

$\endgroup$

1 Answer 1

12
$\begingroup$

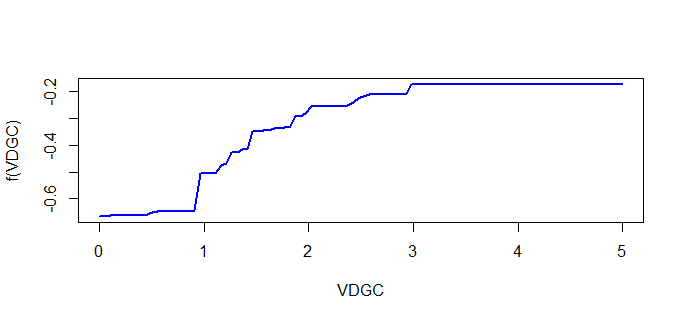
Yes, it's really easy. Check out ?plot.gbm. The usage goes like this:

 plot(gbm.model, i.var = 1, lwd = 2, col = "blue", main = "")

and looks like enter image description here

i.var controls the index of the variable to plot. You can also do two (or more) way plots using

 plot(gbm.model, i.var = c(1,2), lwd = 2, col = "blue", main = "")
$\endgroup$
1
  • 1
    $\begingroup$ thank you, i really appreciate your efforts and time here and in your blog. $\endgroup$ Commented Nov 14, 2013 at 3:12

Your Answer

By clicking “Post Your Answer”, you agree to our terms of service and acknowledge you have read our privacy policy.

Not the answer you're looking for? Browse other questions tagged or ask your own question.