5
$\begingroup$

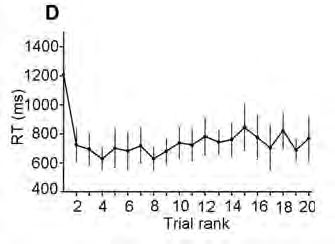
If one has dataset with a single outlier such as the following graph taken from Vanni-Mercer et al. (2009), is there a statistical test that one can use that accounts for the single outlier rather than having to throw it out or declare significance because of a single data point?

RT is reaction time. Trial rank is essentially the trial number. enter image description here
$\endgroup$
1
  • $\begingroup$ This is not my research. The authors kept the first data point in and I was wondering why instead of doing a post-hoc analyses using a Tukey HSD they used some other technique that took into account the outlier. $\endgroup$ Commented Mar 29, 2011 at 2:48

2 Answers 2

4
$\begingroup$

Typically in RT studies there's good reason to believe that the first trials are different qualitatively from the rest and the long RT is merely an indicator of that. Why would you want to bother keeping them?

$\endgroup$
3
  • $\begingroup$ Maybe the original poster is interested in quantifying the phenomenon. $\endgroup$ Commented Mar 28, 2011 at 23:15
  • $\begingroup$ Your answer is useful from a conceptual point of view, but I want to know about statistical tests for phenomena like the data shown. $\endgroup$ Commented Mar 29, 2011 at 12:57
  • $\begingroup$ Then I guess I'd have to ask what you mean by "account for" and "significant" in your question. Perhaps you should edit it to make it more clear what conclusion might be drawn from the data that you don't want and what you would like to achieve. My answer has general applications as well. If a point is really far away from everything else it might be stochastic... or it might just be something that's very different. $\endgroup$
    – John
    Commented Mar 30, 2011 at 1:17
2
$\begingroup$

You might consider checking out the gamm4 package in R, which basically finds a non-linear function that fits the data while auto-penalizing complexity. I recently used it to fit a similar data set, then obtained the residuals and used these to bootstrap pretty confidence ribbons for the fit.

$\endgroup$
1
  • $\begingroup$ My answer assumes that you're doing typical cognitive science work where you have repeated measurement within each of multiple participants and therefore need to model participants as a random effect. If you somehow don't need to specify random effects, then use gam() from the mgcv package (cran.r-project.org/web/packages/mgcv/index.html). $\endgroup$ Commented Mar 28, 2011 at 23:14

Your Answer

By clicking “Post Your Answer”, you agree to our terms of service and acknowledge you have read our privacy policy.

Not the answer you're looking for? Browse other questions tagged or ask your own question.