I am currently trying to compute the BIC for my toy data set (ofc iris (: ). I want to reproduce the results as shown here (Fig. 5). That paper is also my source for the BIC formulas.
I have 2 problems with this:
- Notation:
- $n_i$ = number of elements in cluster $i$
- $C_i$ = center coordinates of cluster $i$
- $x_j$ = data points assigned to cluster $i$
- $m$ = number of clusters
1) The variance as defined in Eq. (2):
$$ \sum_i = \frac{1}{n_i-m}\sum_{j=1}^{n_i}\Vert x_j - C_i \Vert^2 $$
As far as I can see it is problematic and not covered that the variance can be negative when there are more clusters $m$ than elements in the cluster. Is this correct?
2) I just cannot make my code work to compute the correct BIC. Hopefully there is no error, but it would be highly appreciated if someone could check. The whole equation can be found in Eq. (5) in the paper. I am using scikit learn for everything right now (to justify the keyword :P ).
from sklearn import cluster
from scipy.spatial import distance
import sklearn.datasets
from sklearn.preprocessing import StandardScaler
import matplotlib.pyplot as plt
import numpy as np

def compute_bic(kmeans,X):
    """
    Computes the BIC metric for a given clusters

    Parameters:
    -----------------------------------------
    kmeans:  List of clustering object from scikit learn

    X     :  multidimension np array of data points

    Returns:
    -----------------------------------------
    BIC value
    """
    # assign centers and labels
    centers = [kmeans.cluster_centers_]
    labels  = kmeans.labels_
    #number of clusters
    m = kmeans.n_clusters
    # size of the clusters
    n = np.bincount(labels)
    #size of data set
    N, d = X.shape

    #compute variance for all clusters beforehand
    cl_var = [(1.0 / (n[i] - m)) * sum(distance.cdist(X[np.where(labels == i)], [centers[0][i]], 'euclidean')**2)  for i in xrange(m)]

    const_term = 0.5 * m * np.log10(N)

    BIC = np.sum([n[i] * np.log10(n[i]) -
           n[i] * np.log10(N) -
         ((n[i] * d) / 2) * np.log10(2*np.pi) -
          (n[i] / 2) * np.log10(cl_var[i]) -
         ((n[i] - m) / 2) for i in xrange(m)]) - const_term

    return(BIC)


# IRIS DATA
iris = sklearn.datasets.load_iris()
X = iris.data[:, :4]  # extract only the features
#Xs = StandardScaler().fit_transform(X)
Y = iris.target

ks = range(1,10)

# run 9 times kmeans and save each result in the KMeans object
KMeans = [cluster.KMeans(n_clusters = i, init="k-means++").fit(X) for i in ks]

# now run for each cluster the BIC computation
BIC = [compute_bic(kmeansi,X) for kmeansi in KMeans]

plt.plot(ks,BIC,'r-o')
plt.title("iris data  (cluster vs BIC)")
plt.xlabel("# clusters")
plt.ylabel("# BIC")
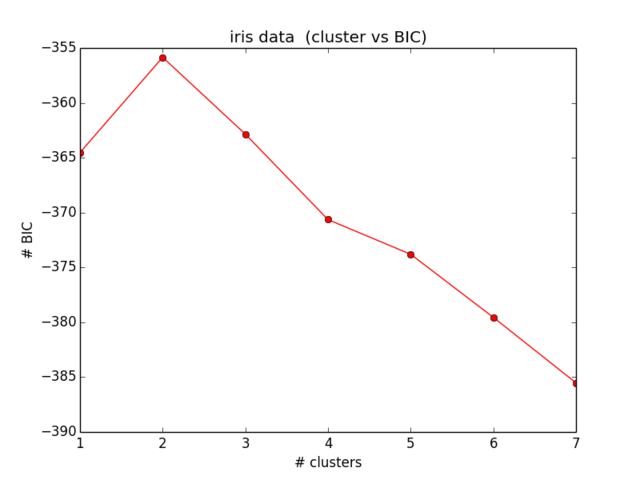
My results for the BIC look like this:
Which is not even close to what I have expected and also makes no sense... I looked at the equations now for some time and am not getting any further locating my mistake ):

