7
$\begingroup$

I'm working on a machine learning project involving statistical analysis (and later discriminatory classification) of different proteins (samples) drawn from multiple, potentially overlapping classes / groups, all of which are drawn from a much larger background population (all mammal proteins).

I have a list of features that I calculate for each individual protein, and then serve as the basis for classification (using machine learning) for each class / group of proteins later. (The features are continuous and numerical, but may be very different, and there's no reason to assume that the underlying distribution is normal, or related).

I want to normalize and center the "raw" calculated feature values for later training. The standard approach of normalizing by a Z-score, then centering [0,1] seems inappropiate, since there's no reason to assume the underlying distributions are normal (I have hundreds of different features - frequency counts, bigrams counts, physiochemical property values etc') .

I've heard of "robust statistical measures", and thought of first normalizing (using the medians) all the features against each other, then applying scikit's normalization+centering to the "median normalized" set of features, but I have no idea if this makes sense, or will retain the differences in the original data.

(Note - I also expect a small amount of significant outliers for different features and properties, so using the median is attractive in that regard as well) . Does this make sense? Is there a better way to normalize between all the groups (Rather than just using raw scores for the features)?

$\endgroup$
5
  • $\begingroup$ What is the goal here? What end do you hope will be better served by using some form of transformation? $\endgroup$ Commented Apr 2, 2014 at 13:26
  • $\begingroup$ I need to normalize the values of features for each sample to a "uniform"/normalized scale, if I want to use it for training a machine learning classifier, or for extracting the relevant features/feature selection using PCA or LDA or the like. $\endgroup$ Commented Apr 2, 2014 at 13:28
  • $\begingroup$ So you want to use some classifier that will only work for data on a [0,1] scale? Couldn't you use a classifier that will work on any data? I think most ML classifiers can handle non-[0,1] data. $\endgroup$ Commented Apr 2, 2014 at 13:30
  • 2
    $\begingroup$ My understanding is that PCA, LDA (Scikit learn implementations) would require normalized data. More than that, I need to normalize the scale of each feature somehow, since values can vary immensely. (An example feature: Length can have values between 120 and 33,000, with most having under 9,000. The frequency of the appearance of a specific sequence motif on the other hand is binary, or ~0-2, while the frequency of a given amino acid-letter bigram is varies depending on the physical length of the underlying protein due to biophysical constraints..) (I plan to extract variables + RF/SVM). $\endgroup$ Commented Apr 2, 2014 at 13:32
  • 1
    $\begingroup$ If I understand well, you want to avoid class skewing (ie, one parameter having more importance than another only because of being a magnitude bigger instead of more pertinent) but not sure that a normal distribution is appropriate. Personally, I have never seen an issue when normalizing data, even if non gaussian, but you might be interested by standardization which does not assume normality, or you might try to combine multiple features and then normalize, in order to reach the central limit theorem (then your features will be normal). $\endgroup$
    – gaborous
    Commented Mar 1, 2018 at 20:48

1 Answer 1

2
$\begingroup$

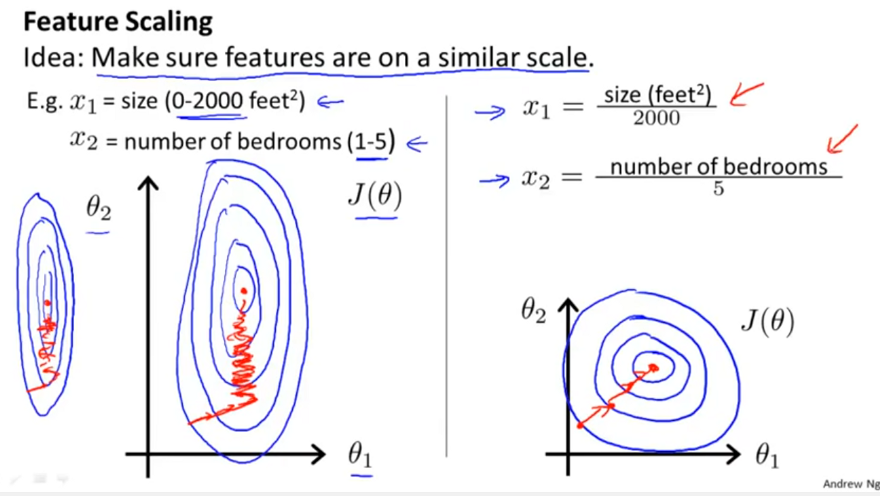
I agree with gaborous in that you maybe seeking standardization, and a quick search for a visualization reveals lectures on why standardization is useful.

TLDW version is that this is all to avoid squashed (elliptical or canoe) shaped input space, because such shapes will cause linear regression to wander.


Screen-Cap Credit to Blitz Kim


Now from what little I've grokked of the fields concerned it seems as though one can get away with ranges that do not produce a nice dartboard like shapes, eg -1 to 1 and 0 to 3, however, ranges greater than 1 or less than -1 may cause high variability in outputs, or lead to the exploding or vanishing gradient problem.

Supposedly there are activation functions and other methods that can be used that are more resilient or less likely to be susceptible to gradients misbehaving, but when a little data massaging can mitigate having a later fight with debugging a model, it seems like a far better choice to pre-clean the input space.


As to what makes sense or not... personally when reading (and re-reading) the question my instinct would be to suggest adapting something like word2vec for the data to input encoding method and feeding that to a GCN for classification and perhaps generation.

Because supposedly word to vector methods better preserve relationships, like similar meanings of words, or perhaps in this case similar functions between proteins that may seem unrelated at first glance in structure. And Graph Convolution Networks, because supposedly they do really well at point cloud inputs, which is kinda what word2vec methods output

But this is just based off speculation on what it is that you're attempting to do, and what I've learned on these subjects. Essentially I'd treat proteins as paragraphs because they express that level of complex meaning/intent.

$\endgroup$

Your Answer

By clicking “Post Your Answer”, you agree to our terms of service and acknowledge you have read our privacy policy.

Not the answer you're looking for? Browse other questions tagged or ask your own question.