8
$\begingroup$

My time series is here and my code is here.

I fit a model to a series with arima() in R with ARMA(5,5) and regression on some covariates.

fit5 = arima(x, order=c(5,0,5), xreg=covaraites, include.mean=F)

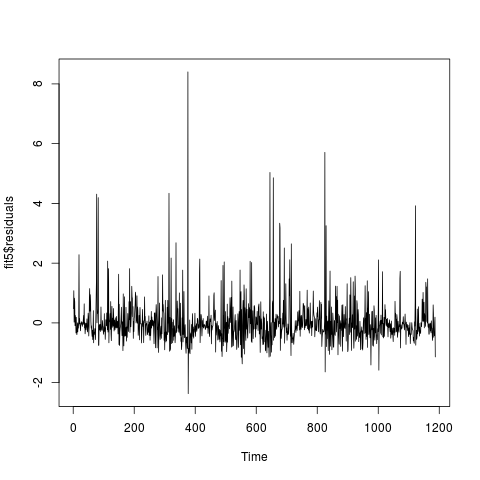
I am now checking if the fitted model is adequate. The residual series looks like:
enter image description here

The residual series pass the Ljung Box test with a p value 0.3859. The ACF and PACF of the residual series are as follows (seems it is uncorrelated, right?):
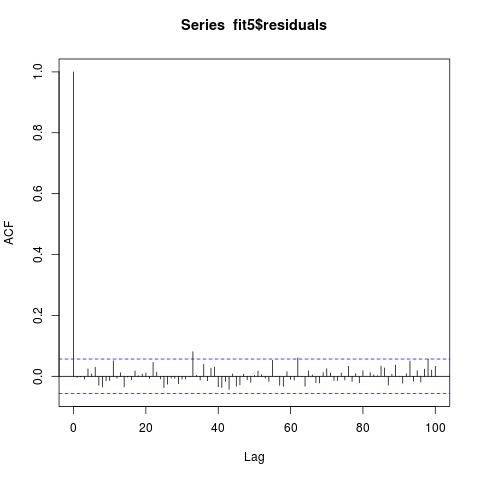
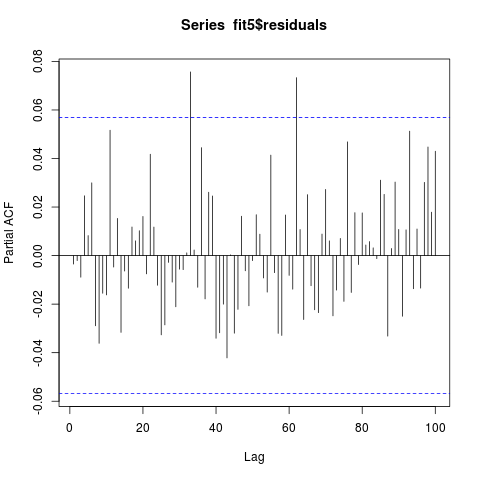
enter image description here enter image description here

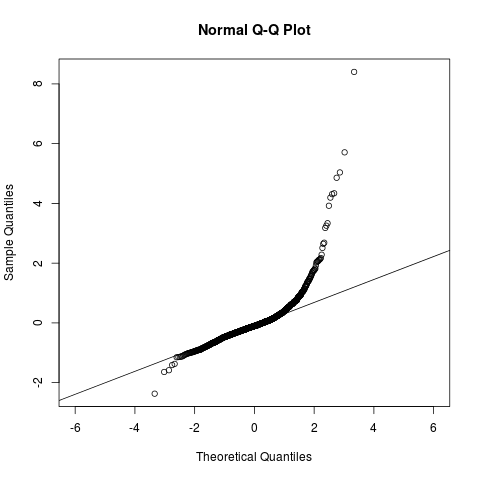
The qqplot for the residual series is as follows:

qqnorm(fit5$residuals, asp = 1)
qqline(fit5$residuals, asp=1)
enter image description here

It looks okay within (-2, 2). I wonder if it is not okay to be Gaussian?

IIC, arma model requires its residual series to be a white noise but not necessarily Gaussian. But arima() fits the model using MLE (assuming Gaussian residual series?). So if my residual series can't be taken as Gaussian, how shall I revise my model and what function in R I can use to fit to my time series?

$\endgroup$
0

3 Answers 3

11
$\begingroup$

When you use MLE a distributional assumption is applied, in this case probably Gaussian. So, if your Gaussian assumption doe not hold, then your likelihood function is messed up, and MLE is not reliable.

The QQ plot does not look good, it shows fatter tails than a normal distribution would have. You can test normality assumption using a number of tests such as Jarque Bera test. I bet they'll all reject the normality.

The first and the simplest thing to try is log-transform. The look of your QQ-plot reminds me of lognormal distribution. You could look at the histogram of residuals and lognormal fit, or simply take the log of the variable re-fit ARIMA, then look at the residuals, I bet they'll look much more normal.

I know some people on this board will suggest to ignore the non-normality of residuals, act as if you never cared for it "because you have a lot of (1200) observations". My stance on this is that if you use normality in any way, such as in your likelihood function, and normality assumption does not hold then you can't use the model.

I suggest you use the models, which do not assume normality, in this case. For example, you could try to fit t-distributed errors. In MATLAB there's an option to use t-distribution in arima class, there could be an option in R too. In any case it would be easy to modify R code, all you need is a new likelihood function, which can be found in a number of places such as MATLAB help.

Another option is to represent ARIMA in state-space form, see e.g. Shumway and Stoffer chapter 6, then use non-Gaussian errors, which is explained in section 6.10, particularly Example 6.23.

$\endgroup$
6
  • $\begingroup$ Thanks. (1) the simplest one you said is to take logarithm of the original time series and then fit with same usage of arima() again, or take logarithm of the residual series and model the residual series (by same usage of arima()?)? (2)The last option by eg. 6.23 in Shunway and Stoffer book doesn't offer R code, does it? $\endgroup$
    – Tim
    Commented May 6, 2014 at 14:46
  • $\begingroup$ (1) If your series positive, take the log of the dependent variable, then fit arima to transformed series. (2) The book comes with R examples, and R package with code and data, check out their web site. It's a great book on time series, and they have the sequel on nonlinear modeling. They also have the free version of the book,all on their website. $\endgroup$
    – Aksakal
    Commented May 6, 2014 at 14:50
  • $\begingroup$ I can't find free version of their nonlinear modeling. Do I miss it? Btw, my time series is here and my code is here. $\endgroup$
    – Tim
    Commented May 6, 2014 at 15:15
  • $\begingroup$ The free version is not for nonlinear book, it's for their first book here. It has the basic material. If you're doing PhD, then you must have access to entire book's 2nd edition through SpringerLink. $\endgroup$
    – Aksakal
    Commented May 6, 2014 at 15:26
  • $\begingroup$ I am not doing PhD, but I will figure out how to find the book through or not through SpringerLink $\endgroup$
    – Tim
    Commented May 6, 2014 at 15:34
5
$\begingroup$

You might need to identify Intervention Variables like Pulses, Seasonal Pulses, Level Shifts or Local Time trends. If these are untreated they inflate the variance of the errors and you get a downwards bias in the ACF of the errors, incorrectly suggesting randomness. Additionally you might need to incorporate lags of your predictors to properly account for their impact. Additionally you might need to use GLS (weighted least squares) or a power transform to deal with non-constant error variance. Finally the parameters of your model might be changing over time requiring segmentation of your data as suggested by the Chow Test.

Commercial software is available to do these things or you might want to write it yourself if you have enough time and skills. One more thing there may may be day-of-the-week-effects or other deterministic structure like a particular day-of-the-month or a particular week-of-the-month effect that needs to be incorporated to make the test for randomness more correct.

$\endgroup$
1
  • $\begingroup$ thanks. Can't afford commercial software. Working in R. So some existing R code will be nice. :) $\endgroup$
    – Tim
    Commented May 6, 2014 at 14:47
1
$\begingroup$

You should check out the "rugarch" package, and in particular the "ARFIMA" class of fits. This allows you to specify a broad class of distributions included those with skew and heavy tails:

http://cran.r-project.org/web/packages/rugarch/rugarch.pdf

$\endgroup$

Your Answer

By clicking “Post Your Answer”, you agree to our terms of service and acknowledge you have read our privacy policy.

Not the answer you're looking for? Browse other questions tagged or ask your own question.