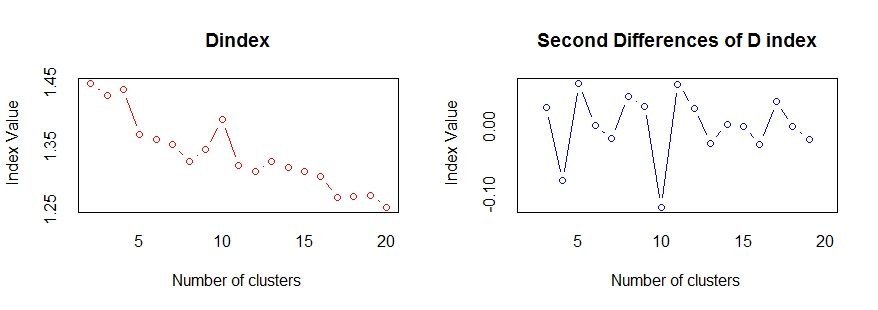
The plots show the output of NbClust(). By looking at the plot, is that correct to say that k=5 is the optimal number of clusters?
> nc <- NbClust(m3, distance="euclidean", min.nc=2, max.nc=20,
+               method="kmeans", index="dindex")
[1] "*** : The D index is a graphical method of determining the number of clusters.
    In the plot of D index, we seek a significant knee (the significant peak in Dindex
    second differences plot) that corresponds to a significant increase of the value of
    the measure."

"All 10829 observations were used."

