Could someone come up with R code to plot an ellipse from the eigenvalues and the eigenvectors of the following matrix $$ \mathbf{A} = \left( \begin{array} {cc} 2.2 & 0.4\\ 0.4 & 2.8 \end{array} \right) $$
2 Answers
You could extract the eigenvectors and -values via eigen(A). However, it's simpler to use the Cholesky decomposition. Note that when plotting confidence ellipses for data, the ellipse-axes are usually scaled to have length = square-root of the corresponding eigenvalues, and this is what the Cholesky decomposition gives.
ctr    <- c(0, 0)                               # data centroid -> colMeans(dataMatrix)
A      <- matrix(c(2.2, 0.4, 0.4, 2.8), nrow=2) # covariance matrix -> cov(dataMatrix)
RR     <- chol(A)                               # Cholesky decomposition
angles <- seq(0, 2*pi, length.out=200)          # angles for ellipse
ell    <- 1 * cbind(cos(angles), sin(angles)) %*% RR  # ellipse scaled with factor 1
ellCtr <- sweep(ell, 2, ctr, "+")               # center ellipse to the data centroid
plot(ellCtr, type="l", lwd=2, asp=1)            # plot ellipse
points(ctr[1], ctr[2], pch=4, lwd=2)            # plot data centroid

library(car)  # verify with car's ellipse() function
ellipse(c(0, 0), shape=A, radius=0.98, col="red", lty=2)
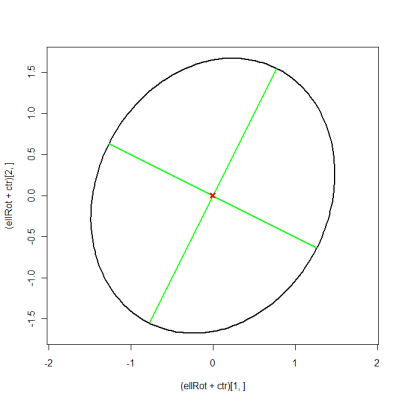
Edit: in order to plot the eigenvectors as well, you have to use the more complicated approach. This is equivalent to suncoolsu's answer, it just uses matrix notation to shorten the code.
eigVal  <- eigen(A)$values
eigVec  <- eigen(A)$vectors
eigScl  <- eigVec %*% diag(sqrt(eigVal))  # scale eigenvectors to length = square-root
xMat    <- rbind(ctr[1] + eigScl[1, ], ctr[1] - eigScl[1, ])
yMat    <- rbind(ctr[2] + eigScl[2, ], ctr[2] - eigScl[2, ])
ellBase <- cbind(sqrt(eigVal[1])*cos(angles), sqrt(eigVal[2])*sin(angles)) # normal ellipse
ellRot  <- eigVec %*% t(ellBase)                                          # rotated ellipse
plot((ellRot+ctr)[1, ], (ellRot+ctr)[2, ], asp=1, type="l", lwd=2)
matlines(xMat, yMat, lty=1, lwd=2, col="green")
points(ctr[1], ctr[2], pch=4, col="red", lwd=3)

-
$\begingroup$ Would you mind to plot the eigenvalues and eigenvectors on this ellipse? Thanks $\endgroup$ Commented Apr 23, 2011 at 10:05
-
$\begingroup$ @MYaseen208 I edited my answer to show the eigenvectors as the ellipse's axes. Half the axes' length equals the square-root of the corresponding eigenvectors. $\endgroup$– caracalCommented Apr 23, 2011 at 15:05
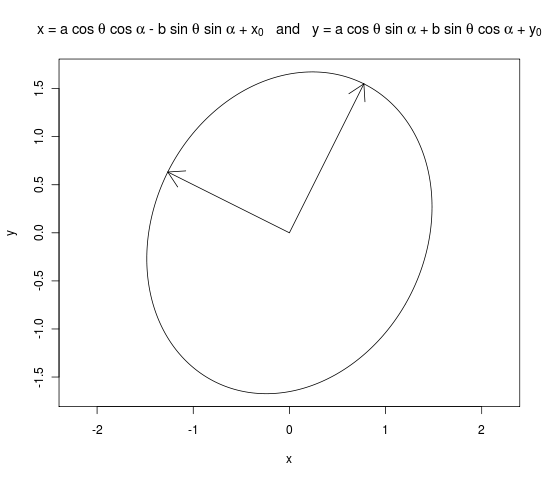
I think this is the R code that you want. I borrowed the R-code from this thread on the r-mailing list. The idea basically is: the major and minor half-diameters are the two eigen values and you rotate the ellipse by the amount of angle between the first eigen vector and the x-axis
mat <- matrix(c(2.2, 0.4, 0.4, 2.8), 2, 2)
eigens <- eigen(mat)
evs <- sqrt(eigens$values)
evecs <- eigens$vectors

a <- evs[1]
b <- evs[2]
x0 <- 0
y0 <- 0
alpha <- atan(evecs[ , 1][2] / evecs[ , 1][1])
theta <- seq(0, 2 * pi, length=(1000))

x <- x0 + a * cos(theta) * cos(alpha) - b * sin(theta) * sin(alpha)
y <- y0 + a * cos(theta) * sin(alpha) + b * sin(theta) * cos(alpha)


png("graph.png")
plot(x, y, type = "l", main = expression("x = a cos " * theta * " + " * x[0] * " and y = b sin " * theta * " + " * y[0]), asp = 1)
arrows(0, 0, a * evecs[ , 1][2], a * evecs[ , 1][2])
arrows(0, 0, b * evecs[ , 2][3], b * evecs[ , 2][2])
dev.off()

-
$\begingroup$ please feel free to correct me. I don't think the eigen vecs are perpendicular (they must be in theory; may be I am plotting something wrong?). $\endgroup$ Commented Apr 23, 2011 at 9:19
-
$\begingroup$ Thanks for your reply. This ellipse looks nice but something is missing there. I tried your given code with this matrix $\begin{equation*} \mathbf{A} = \left( \begin{array} {cc} 1 & -5\\ -5 & 1 \end{array} \right) \end{equation*}$ and it gave correct ellipse. I'm wondering why it is not providing the correct ellipse for different variances in the matrix. Any comment! $\endgroup$ Commented Apr 23, 2011 at 10:01
-
$\begingroup$ Just set
asp=1to have an aspect ratio of 1 and perpendicular arrows. Changing your code toevs <- sqrt(eigens$values)gives the same ellipse as my answer. $\endgroup$– caracalCommented Apr 23, 2011 at 10:47 -
3$\begingroup$ @MYaseen208 Your new matrix is not positive definite: it has negative eigenvalues and isn't a possible covariance matrix. I don't know what ellipse to draw in that case. $\endgroup$– caracalCommented Apr 23, 2011 at 10:49
-
$\begingroup$ @caracal thanks! ... yeah -- I missed the sqrt part! $\endgroup$ Commented Apr 23, 2011 at 18:18

R-oriented, the answers are applicable to all statistical computing. Therefore I have reopened this question. $\endgroup$