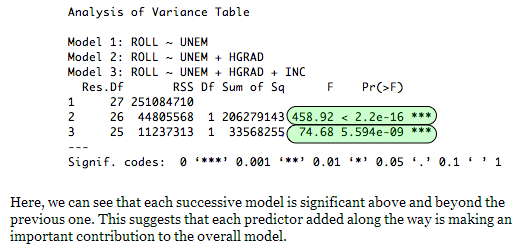
I followed this tutorial to learn Hierarchical Linear Regression (HLR) in R, but couldn't understand how to interpret its sample output of >anova(model1,model2,model3)

The tutorial simply says
each predictor added along the way is making an important contribution to the overall model.
But I would like some more details to quantify the contribution of each explanatory variable, like:
"UNEM" explains
X(orX%) devianceAdding the "HGRAD" variable explains
Y(orY%) more devianceAdding the "INC" variable further explains
Z(orZ%) more deviance
So, can I get the value of X, Y, and Z using the above ANOVA table? How? Specifically, what do Res.Df, RSS, Sum of Sq mean in this ANOVA table?
