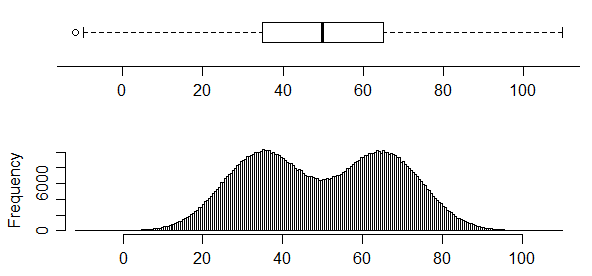
The problem is that the usual boxplot generally can't give an indication of the number of modes. While in some (generally rare) circumstances, it is possible to get a clear indication that the smallest number of modes exceeds 1, more usually a given boxplot is consistent with one or any larger number of modes.
For example, while this plot does indicate the presence of at least two modes (the data were generated so as to have exactly two) -
$\qquad\qquad $ 
conversely, this one has two very clear modes in its distribution but you simply can't tell that from the boxplot at all:

Boxplots don't necessarily convey a lot of information about the distribution. In the absence of any marked points outside the whiskers, they contain only five values, and a five number summary doesn't pin down the distribution much.
Indeed, figure 1 here (which I believe is a working paper later published in [1]) shows four different data sets with the same box plot.
I don't have that data to hand, but it's a trivial matter to make a similar data set - as indicated in the link above related to the five-number summary, we need only constrain our distributions to lie within the rectangular boxes that the five number summary restricts us to.
(Beware, however -- histograms can have problems, too! -- and as Nick says, kernel density estimates may also affect the impression of the number of modes.)
There are modifications of the boxplot that can better indicate multimodality (vase plots, violin plots and bean plots, among numerous others). In some situations they may be useful, but if I'm interested in finding modes I'll usually look at a different sort of display.
Boxplots are better when interest focuses on comparisons of location and spread (and perhaps to skewness) rather than the particulars of distributional shape. If multimodality is important to show, I'd suggest looking at displays that are better at showing that - the precise choice of display depends on what you most want it to show well.
[1]: Choonpradub, C., & McNeil, D. (2005),
"Can the boxplot be improved?"
Songklanakarin J. Sci. Technol., 27:3, pp. 649-657.
http://www.jourlib.org/paper/2081800
pdf
