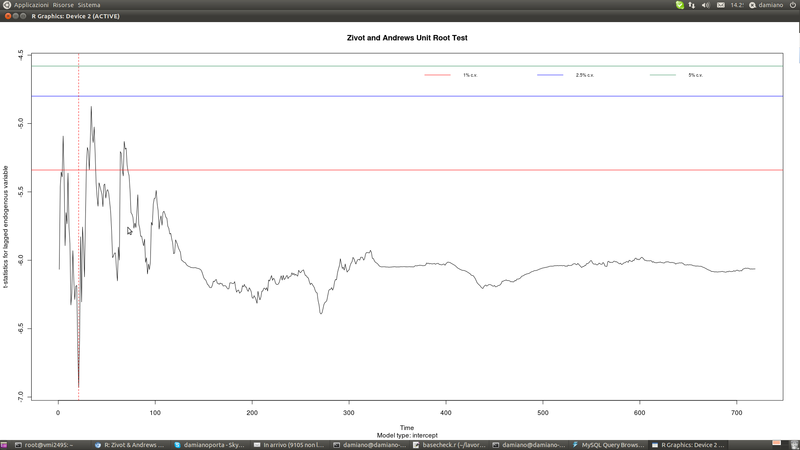
I'm check the residuals of a linear regression with Zivot & Andrews unit root test.
This is the plot:

And the results are:
> z <- ur.za(resid(mod), model='intercept')
> summary(z)

################################
# Zivot-Andrews Unit Root Test #
################################


Call:
lm(formula = testmat)

Residuals:
    Min      1Q  Median      3Q     Max
-6.9484 -0.3336 -0.0052  0.3486  4.6749

Coefficients:
              Estimate Std. Error t value Pr(>|t|)
(Intercept)  0.8358245  0.2559622   3.265 0.001145 **
y.l1         0.9056053  0.0136199  66.491  < 2e-16 ***
trend        0.0002781  0.0001612   1.725 0.084992 .
du          -0.9509595  0.2686740  -3.539 0.000427 ***
---
Signif. codes:  0 ‘***’ 0.001 ‘**’ 0.01 ‘*’ 0.05 ‘.’ 0.1 ‘ ’ 1

Residual standard error: 0.8534 on 715 degrees of freedom
  (1 observation deleted due to missingness)
Multiple R-squared: 0.9221, Adjusted R-squared: 0.9218
F-statistic:  2823 on 3 and 715 DF,  p-value: < 2.2e-16


Teststatistic: -6.9306
Critical values: 0.01= -5.34 0.05= -4.8 0.1= -4.58

Potential break point at position: 21
A potential break at position 21 seems correct, but the test tells there is not a unit root...so, how is it possible that the test "pass" for unit root checks but it also gives a potential break? How to interpret the chart?
Thank you!
