I am testing to see if there is a relationship between my dependent variable Y and any of 4 explanitory variables x1, x2, x3 or x4
First I started by doing simple linear regression and got these results:
fit<-lm( Y ~ x1 , data=data)
summary(fit)  # R square .05
fit<-lm( Y ~ x2, data=data)
summary(fit)   # R square -.001
fit<-lm( Y ~  x3 , data=data)
summary(fit)  # R square .01
fit<-lm( Y ~  x4, data=data)
summary(fit)  ###### R square .42
fit<-lm( Y ~  x1+ x2+ x3 + x4, data=data)
summary(fit) ####### R square .46
So looking at those results I don't see much. There is an R squared of .42 and .46 when I am regress x4 but it is only .42. I am thinking that there is not relationship here. Am I correct?
I looked into scaling because X1 and X2 are larger in scale but the regression results and R squared values did not change here are the min/max for X1, X2, X3, X4:
summary(as.numeric(data$x1) )
summary(as.numeric(data$x2) )
summary(as.numeric(data$x3) )
summary(as.numeric(data$x4) )

> summary(as.numeric(data$x1) )
   Min. 1st Qu.  Median    Mean 3rd Qu.    Max.
   2500  100000  209200  333100  500000 3000000
> summary(as.numeric(data$x2) )
    Min.  1st Qu.   Median     Mean  3rd Qu.     Max.
   57440  1146000  2603000  4395000  5142000 47050000
> summary(as.numeric(data$x3) )
     Min.   1st Qu.    Median      Mean   3rd Qu.      Max.
  0.01667   0.33330   0.51670   1.52400   1.50000 232.50000
> summary(as.numeric(data$x4) )
   Min. 1st Qu.  Median    Mean 3rd Qu.    Max.
 -9.187   6.814  16.700  22.920  29.590 177.300
I also looked at the residuals of the fit<-lm( Y ~ x1+ x2+ x3 + x4, data=data) regression to see if the residuals were normal and there are not. I used a qqnorm plot, jarque bera and shapiro wilk:
r<-resid(fit)
plot(r)
qqnorm(r) # residual does not look normal there are huge diviations in the tails
qqline(r)
jarque.bera.test(r) #pvalue < .05 so residual is not normal
shapiro.test(r) #pvalue <.05 so residual is not normal
Since the residuals are not normal I am concluding that fit<-lm( Y ~ x1+ x2+ x3 + x4, data=data) is not a good model. Is that correct?
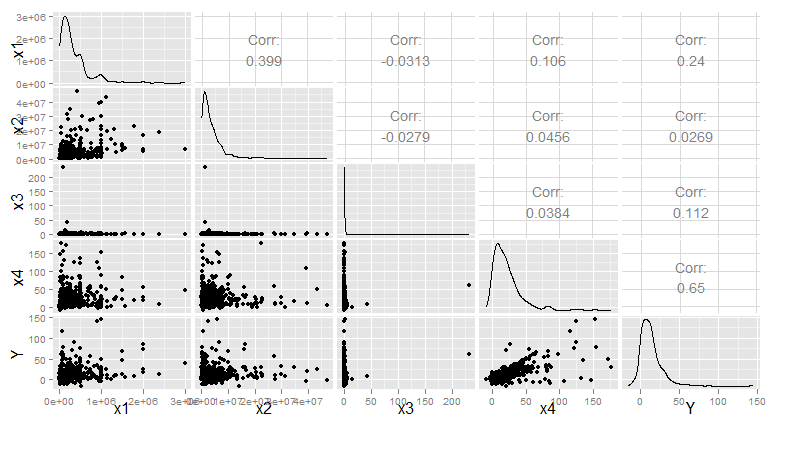
here is a plot of the data

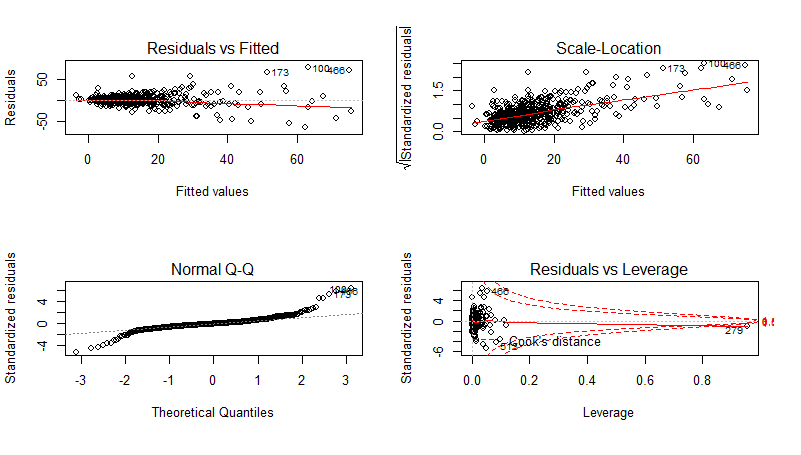
here is plot(fit)

I am new to multivariable regression and was wondering if you could advise me what if anything I could/should do next to determine is there is a relationship. Are there other strategies I should look at to see if there is a relationship.
Thank you for your time. Here are the actual regression results:
> fit<-lm( Y ~ x1 , data=data)
> summary(fit)

Call:
lm(formula = Y ~ x1, data = data)

Residuals:
    Min      1Q  Median      3Q     Max
-32.080  -9.428  -3.143   4.303 123.535

Coefficients:
             Estimate Std. Error t value Pr(>|t|)
(Intercept) 1.007e+01  9.560e-01  10.532  < 2e-16 ***
x1          1.144e-05  1.965e-06   5.821 9.93e-09 ***
---
Signif. codes:  0 ‘***’ 0.001 ‘**’ 0.01 ‘*’ 0.05 ‘.’ 0.1 ‘ ’ 1

Residual standard error: 16.4 on 552 degrees of freedom
Multiple R-squared:  0.05783,   Adjusted R-squared:  0.05613
F-statistic: 33.88 on 1 and 552 DF,  p-value: 9.926e-09

> fit<-lm( Y ~ x2, data=data)
> summary(fit)

Call:
lm(formula = Y ~ x2, data = data)

Residuals:
    Min      1Q  Median      3Q     Max
-30.630 -10.064  -3.525   4.662 131.045

Coefficients:
             Estimate Std. Error t value Pr(>|t|)
(Intercept) 1.354e+01  8.921e-01  15.181   <2e-16 ***
x2          7.634e-08  1.206e-07   0.633    0.527
---
Signif. codes:  0 ‘***’ 0.001 ‘**’ 0.01 ‘*’ 0.05 ‘.’ 0.1 ‘ ’ 1

Residual standard error: 16.89 on 552 degrees of freedom
Multiple R-squared:  0.000725,  Adjusted R-squared:  -0.001085
F-statistic: 0.4005 on 1 and 552 DF,  p-value: 0.5271

> fit<-lm( Y ~  x3 , data=data)
> summary(fit)

Call:
lm(formula = Y ~ x3, data = data)

Residuals:
    Min      1Q  Median      3Q     Max
-29.660 -10.207  -3.195   4.666 130.886

Coefficients:
            Estimate Std. Error t value Pr(>|t|)
(Intercept) 13.59186    0.72132  18.843  < 2e-16 ***
x3           0.18843    0.07093   2.657  0.00812 **
---
Signif. codes:  0 ‘***’ 0.001 ‘**’ 0.01 ‘*’ 0.05 ‘.’ 0.1 ‘ ’ 1

Residual standard error: 16.79 on 552 degrees of freedom
Multiple R-squared:  0.01262,   Adjusted R-squared:  0.01084
F-statistic: 7.058 on 1 and 552 DF,  p-value: 0.008122

> fit<-lm( Y ~  x4, data=data)
> summary(fit)

Call:
lm(formula = Y ~ x4, data = data)

Residuals:
    Min      1Q  Median      3Q     Max
-69.302  -4.355  -0.970   4.667  81.136

Coefficients:
            Estimate Std. Error t value Pr(>|t|)
(Intercept)  3.94034    0.73664   5.349  1.3e-07 ***
x4           0.43353    0.02159  20.081  < 2e-16 ***
---
Signif. codes:  0 ‘***’ 0.001 ‘**’ 0.01 ‘*’ 0.05 ‘.’ 0.1 ‘ ’ 1

Residual standard error: 12.84 on 552 degrees of freedom
Multiple R-squared:  0.4221,    Adjusted R-squared:  0.4211
F-statistic: 403.2 on 1 and 552 DF,  p-value: < 2.2e-16

> fit<-lm( Y ~  x1+ x2+ x3 + x4, data=data)
> summary(fit)

Call:
lm(formula = Y ~ x1 + x2 + x3 + x4, data = data)

Residuals:
    Min      1Q  Median      3Q     Max
-63.697  -4.918  -0.487   4.119  76.460

Coefficients:
              Estimate Std. Error t value Pr(>|t|)
(Intercept)  1.744e+00  8.672e-01   2.012  0.04476 *
x1           9.994e-06  1.625e-06   6.150 1.49e-09 ***
x2          -2.351e-07  9.639e-08  -2.439  0.01505 *
x3           1.552e-01  5.236e-02   2.964  0.00317 **
x4           4.189e-01  2.094e-02  20.007  < 2e-16 ***
---
Signif. codes:  0 ‘***’ 0.001 ‘**’ 0.01 ‘*’ 0.05 ‘.’ 0.1 ‘ ’ 1

Residual standard error: 12.37 on 549 degrees of freedom
Multiple R-squared:  0.4665,    Adjusted R-squared:  0.4627
F-statistic:   120 on 4 and 549 DF,  p-value: < 2.2e-16
