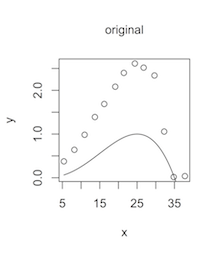
First, let's clarify what it means "to see how well my data fits to the equation" when you have a fixed equation as in your original question. You have data on $x$ and $y$, and your equation: $$y=(3.5-(x/10))(x/25)^{5/2}$$ has no free parameters. Here's a plot; data points are circles, the equation a solid curve:
So to answer your original question, your data don't fit that equation very well.
Second, "fitting an equation" generally means having a general form of a relation between $y$ and $x$ in mind, but the details of the form depend on some additional unknown parameters of the equation. "Fitting" then means using the data to estimate the values of the parameters that best match the data, say by minimizing the sum of the squares of the discrepancies between the curve and the data. That is what's implicit in the form of the equation in your comment. (I corrected an apparently missing parenthesis so that it matches your original parameter-free equation at $z=25$):
$$y = \frac{35-x}{35-z}\left(\frac{x}{z}\right)^{(z/10)}$$
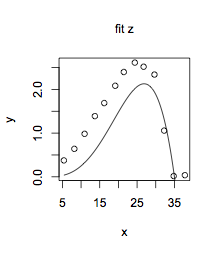
Now there is something to "fit": find the value of $z$ that comes closest to your data. The simplest R function to do this is nls. (The R code I used is at the end of the answer.) The best fit to your $x$ and $y$ data is provided by a $z$ value of 33.1, not the value of 25 that would match your first parameter-free equation. It comes closer, but doesn't do very well, either, substantially below most of the true values:
It looks like your equation might have an even more general form, like:
$$y = \frac{a-x}{a-z}\left(\frac{x}{z}\right)^{(z/b)}$$
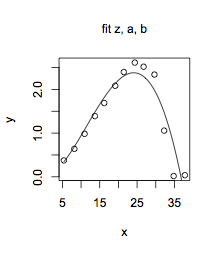
where $z$, $a$ and $b$ are parameters whose values might be estimated from the data. With that more general form, you can come fairly close to your data, at $z=34.0$, $a=36.7$, and $b=17.8$:

Third, you must be very careful if you head down this fitting path. As John von Neumann allegedly said, "With four parameters I can fit an elephant, and with five I can make him wiggle his trunk." Overfitting is a serious temptation when you start playing with data.
In a case like yours you have to think about what the parameters might mean in the real world. It seems that there are competing processes that lead to a peak in growth rate ($y$) at a certain temperature ($x$), and if the parameters $z$, $a$ and $b$ have definite meanings in terms of those competing processes then you might be justified in doing this type of fit. You might, say, learn something about how those processes differ from one strain of bacteria to another. But if such parameters (or the fixed values in your original equation) were simply chosen by someone to make some earlier set of data fit a particular curve then you are headed for big trouble.
Finally, in terms of R code, it was simplest to define a general function for your temperature-response curve:
trcFunc <- function(x,z,a,b){((a-x)/(a-z))*((x/z)^(z/b))}
then give specific values for the parameters that matched your original equation, to compare your data to the curve:
plot(x,y)
curve(trcFunc(x,25,35,10),add=TRUE)
For fitting, I used the nls function, for example for $z$ alone
Zfit <- nls(y~trcFunc(x,z,35,10),start=list(z=30))
or for all 3 parameter values
ZABfit <- nls(y~trcFunc(x,z,a,b),start=list(z=30,a=35,b=10))
Get the fitted parameter values with
ZABfit
and compare data and curve:
plot(x,y,main="fit z, a, b")
curve(trcFunc(x,33.98,36.74,17.84),add=TRUE)
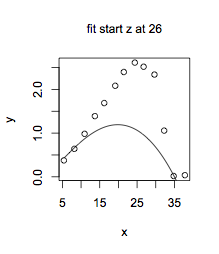
Note that, as can happen in non-linear curve fitting, what you get as the "best" fit can depend on what you provide as an initial guess for the parameter values. With your data, if I provided an initial guess of 26 for $z$ and fixed values of 35 and 10 for $a$ and $b$:
Zfit26start <- nls(y~trcFunc(x,z,35,10),start=list(z=26))
the value returned for $z$ is 13.1,which doesn't fit very well at all:


