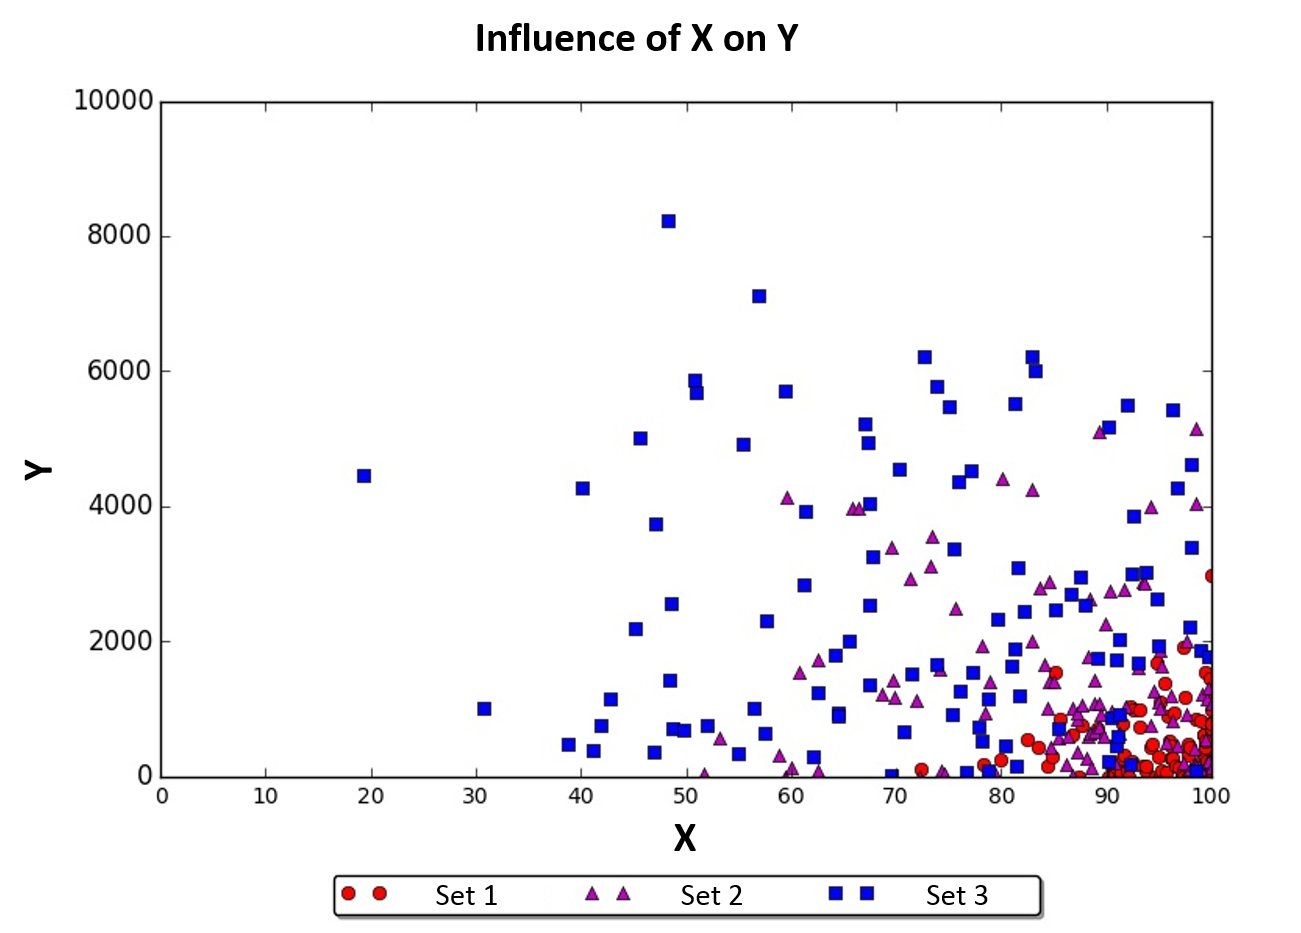
Based on three datasets, I have produced the scatterplot below in Python:

I am trying to fit a line on each dataset, but when I check the metrics this is what I get:
- Set 1 (red): $R^2$=0.002, p-value=0.651
- Set 2 (purple): $R^2$=0.008, p-value=0.378
- Set 3 (blue): $R squared$=0.001, p-value=0.714
My question: are such data sets impossible to fit? Is there any kind of data transformation I could apply, based on the scatterplot shape?
My Values (red dataset):
X       Y
72.3    109
78.34   169
80      239
82.4    550
83.49   429
84.34   162
84.78   285
85.18   1553
85.58   852
86.73   611
87.34   0
87.65   764
89.09   710
90.18   0
90.49   155
90.66   2
90.73   42
90.75   162
91.23   0
91.31   57
91.51   275
91.58   771
91.73   324
91.93   78
92.1    0
92.22   1023
92.36   223
92.49   981
93.17   978
93.17   744
93.47   162
93.75   76
93.8    163
94.12   433
94.27   472
94.59   0
94.73   1689
94.87   302
95.05   0
95.09   1100
95.26   73
95.49   1370
95.69   72
95.84   890
96.02   529
96.07   273
96.08   458
96.23   281
96.42   933
96.52   149
96.93   135
97.21   7
97.36   1912
97.38   0
97.5    1169
97.72   0
97.77   314
97.81   475
97.91   436
98.25   56
98.33   5
98.36   0
98.43   135
98.45   81
98.46   849
98.79   20
98.91   818
98.91   58
99.11   244
99.21   348
99.28   621
99.29   618
99.34   430
99.4    513
99.41   49
99.43   1543
99.46   23
99.46   62
99.57   178
99.58   50
99.58   221
99.78   179
99.83   1446
99.94   1249
99.94   9
99.94   7
99.94   10
99.97   0
99.98   228
99.99   111
99.99   711
100     976
100     2980
100     72
100     1
100     24
100     698
100     803
100     774
100     0
