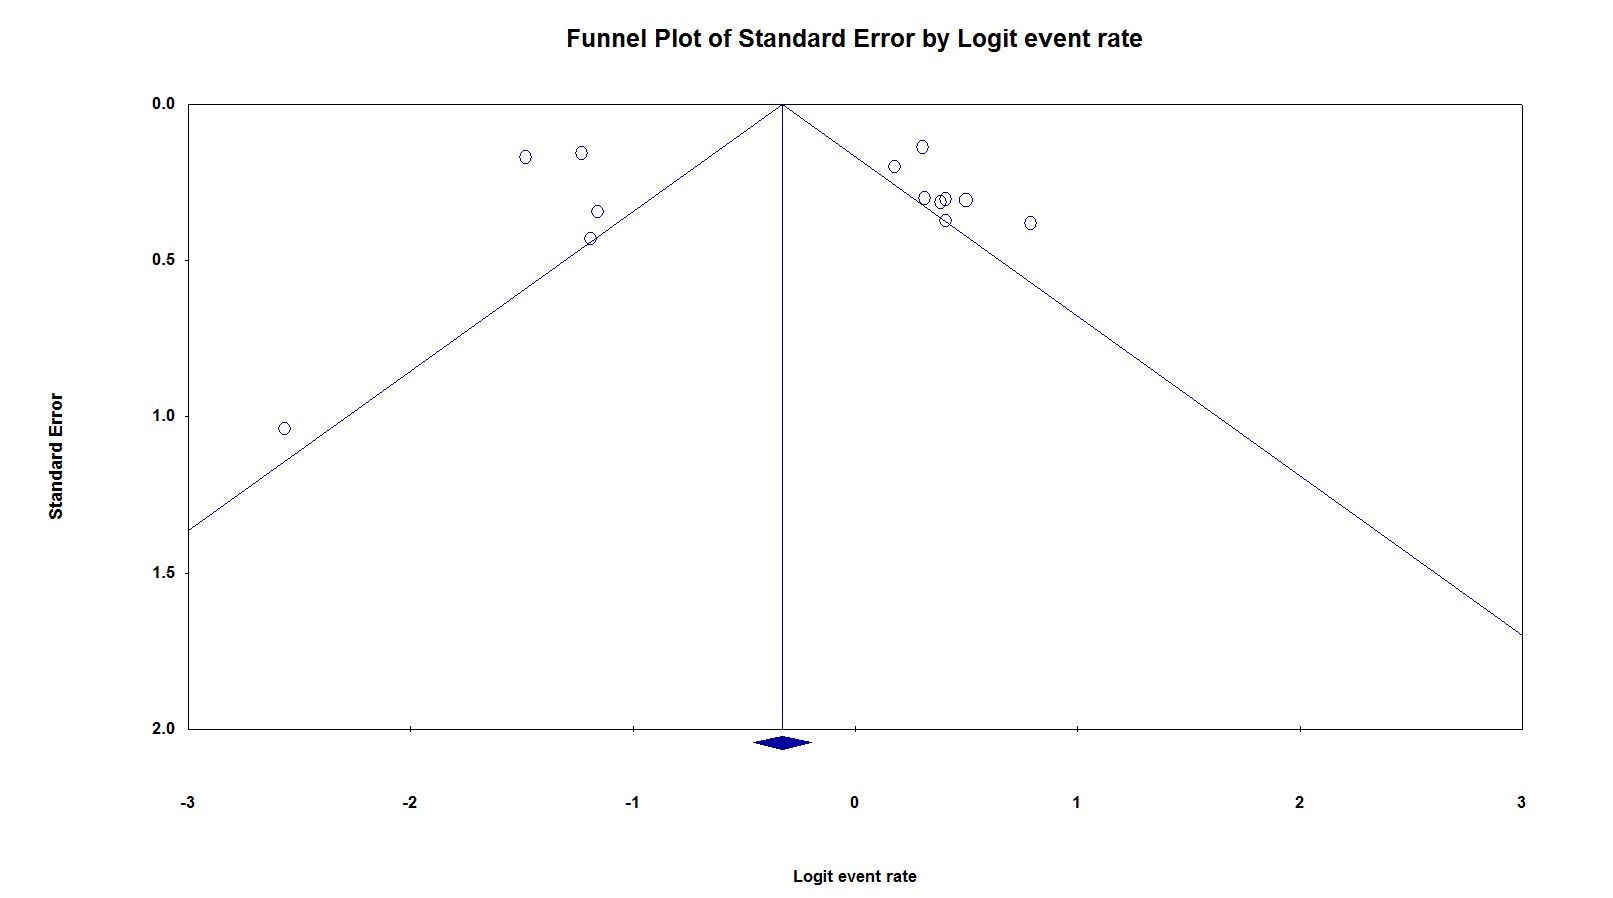
hopefully someone can assist a bit, I just came across a funnel plot that I can not interpret. I have a feeling it is due to the high heterogeneity in the Meta-analysis. (I2= 92%)
Basically, this was a systematic review assessing the incidence of h pylori infections in patients with a specific symptom. All papers werr included, rct, cohorts, case series. The primary endpoint was incidence of the infection in this population. There werr 14 studies in total included. We then did a one way meta anaysis (which u see) using random effects model to get an estimate and 95%ci of the incidence. Some patients had reflux. Disease and some didn't, so i wonder is it possible that the clustering is due to "groups" of studies. Please let me know what additional info would help. Therr is also different methods of. Diagnosis used in each study, different countries which would affect rates of infection. All increasing heterogeneity.
Any thoughts would be appreciated.

