I don’t really get what you mean with AGWN, is this simply that $n(t_i)$ are independent with $n(t_i) \sim N(0,\sigma^2)$?
Least square are easy with numerical methods, here is piece of R code:
a <- 2; b <- 0.2; c <- -1
t <- seq(-5,10, length=100)
y <- a*exp(-b*t)+c+rnorm(length(t), sd=2)
f <- function(par, t, y) {
  a <- par[1]; b <- par[2]; c <- par[3];
  return(sum((a*exp(-b*t)+c-y)**2 ) ); }
nlm( function(par) f(par, t, y), c(0,0,0))
The result of the last call is
$minimum
[1] 430.8242

$estimate
[1]  2.0875336  0.1961210 -0.8672079

$gradient
[1]  1.301591e-05 -2.745537e-05  2.603429e-05

$code
[1] 1

$iterations
[1] 19
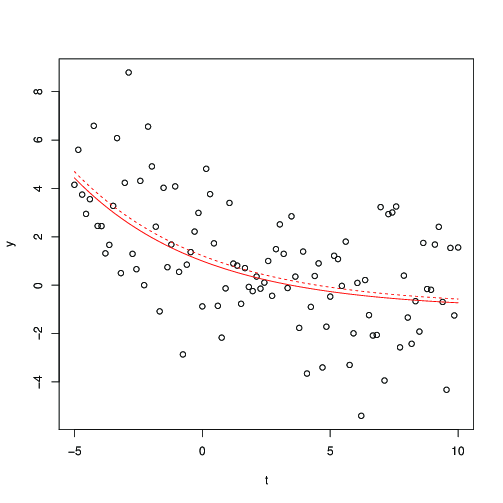
Our initial values (2, 0.2, -1) are estimated by (2.088, 0.196, -0.867). You can get a plot of the data points, the "true model" (red line) and the estimated model (dotted red line) as follows:
plot(t,y)
lines( t, a*exp(-b*t)+c, col="red")
nlm( function(par) f(par, t, y), c(0,0,0))$estimate -> r
lines( t, r[1]*exp(-r[2]*t)+r[3], col="red", lty=2)

