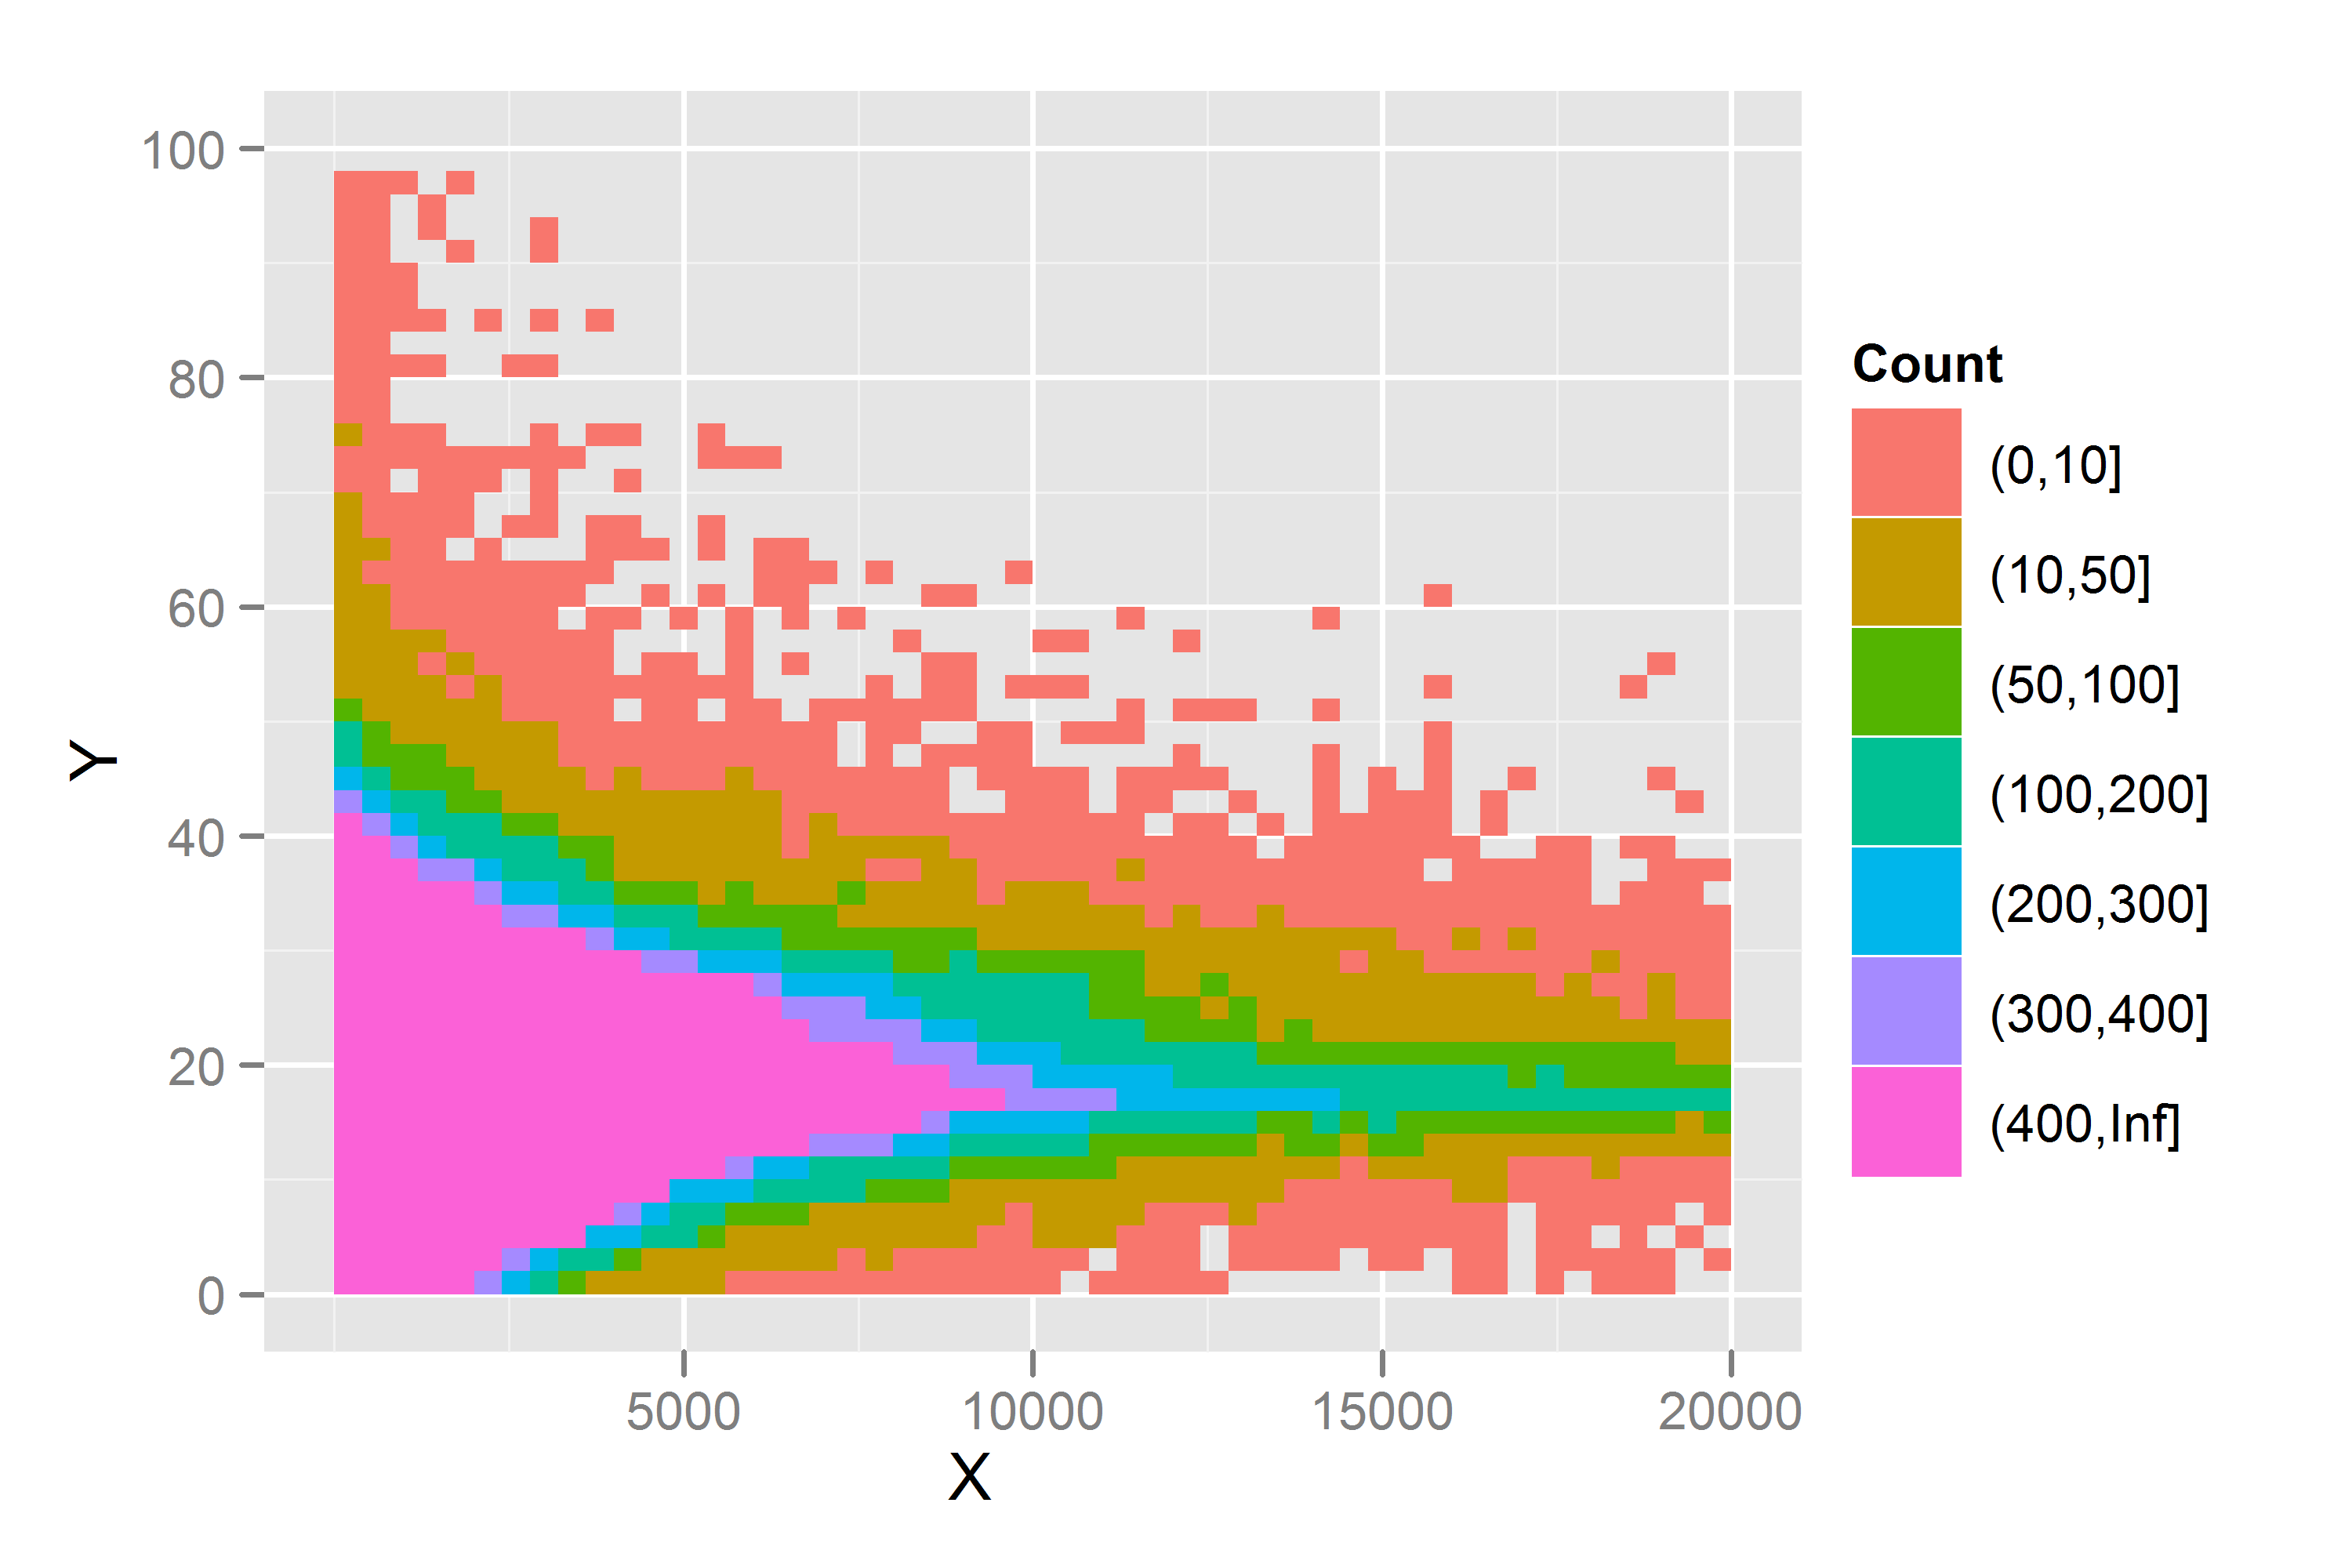
I have observed the following pattern of behavior in my data-set and I'm wondering how I can explore whether I can predict Y using a value of X. This plot is a 2D histogram of values.

I have previously explored interquartile regression to identify the upper bound, but I'm wondering if there are any other approaches which I can apply which would enable me to identify the range of Y, depending on the X value. I assumed with heteroskedastic data like this that I would need to apply a transformation, but I'm not sure if this is the correct approach.
Could I just fit an interquartile regression to the upper and lower bounds and then provide an estimated value (with an error) for any value of Y that is predicted?
EDIT:
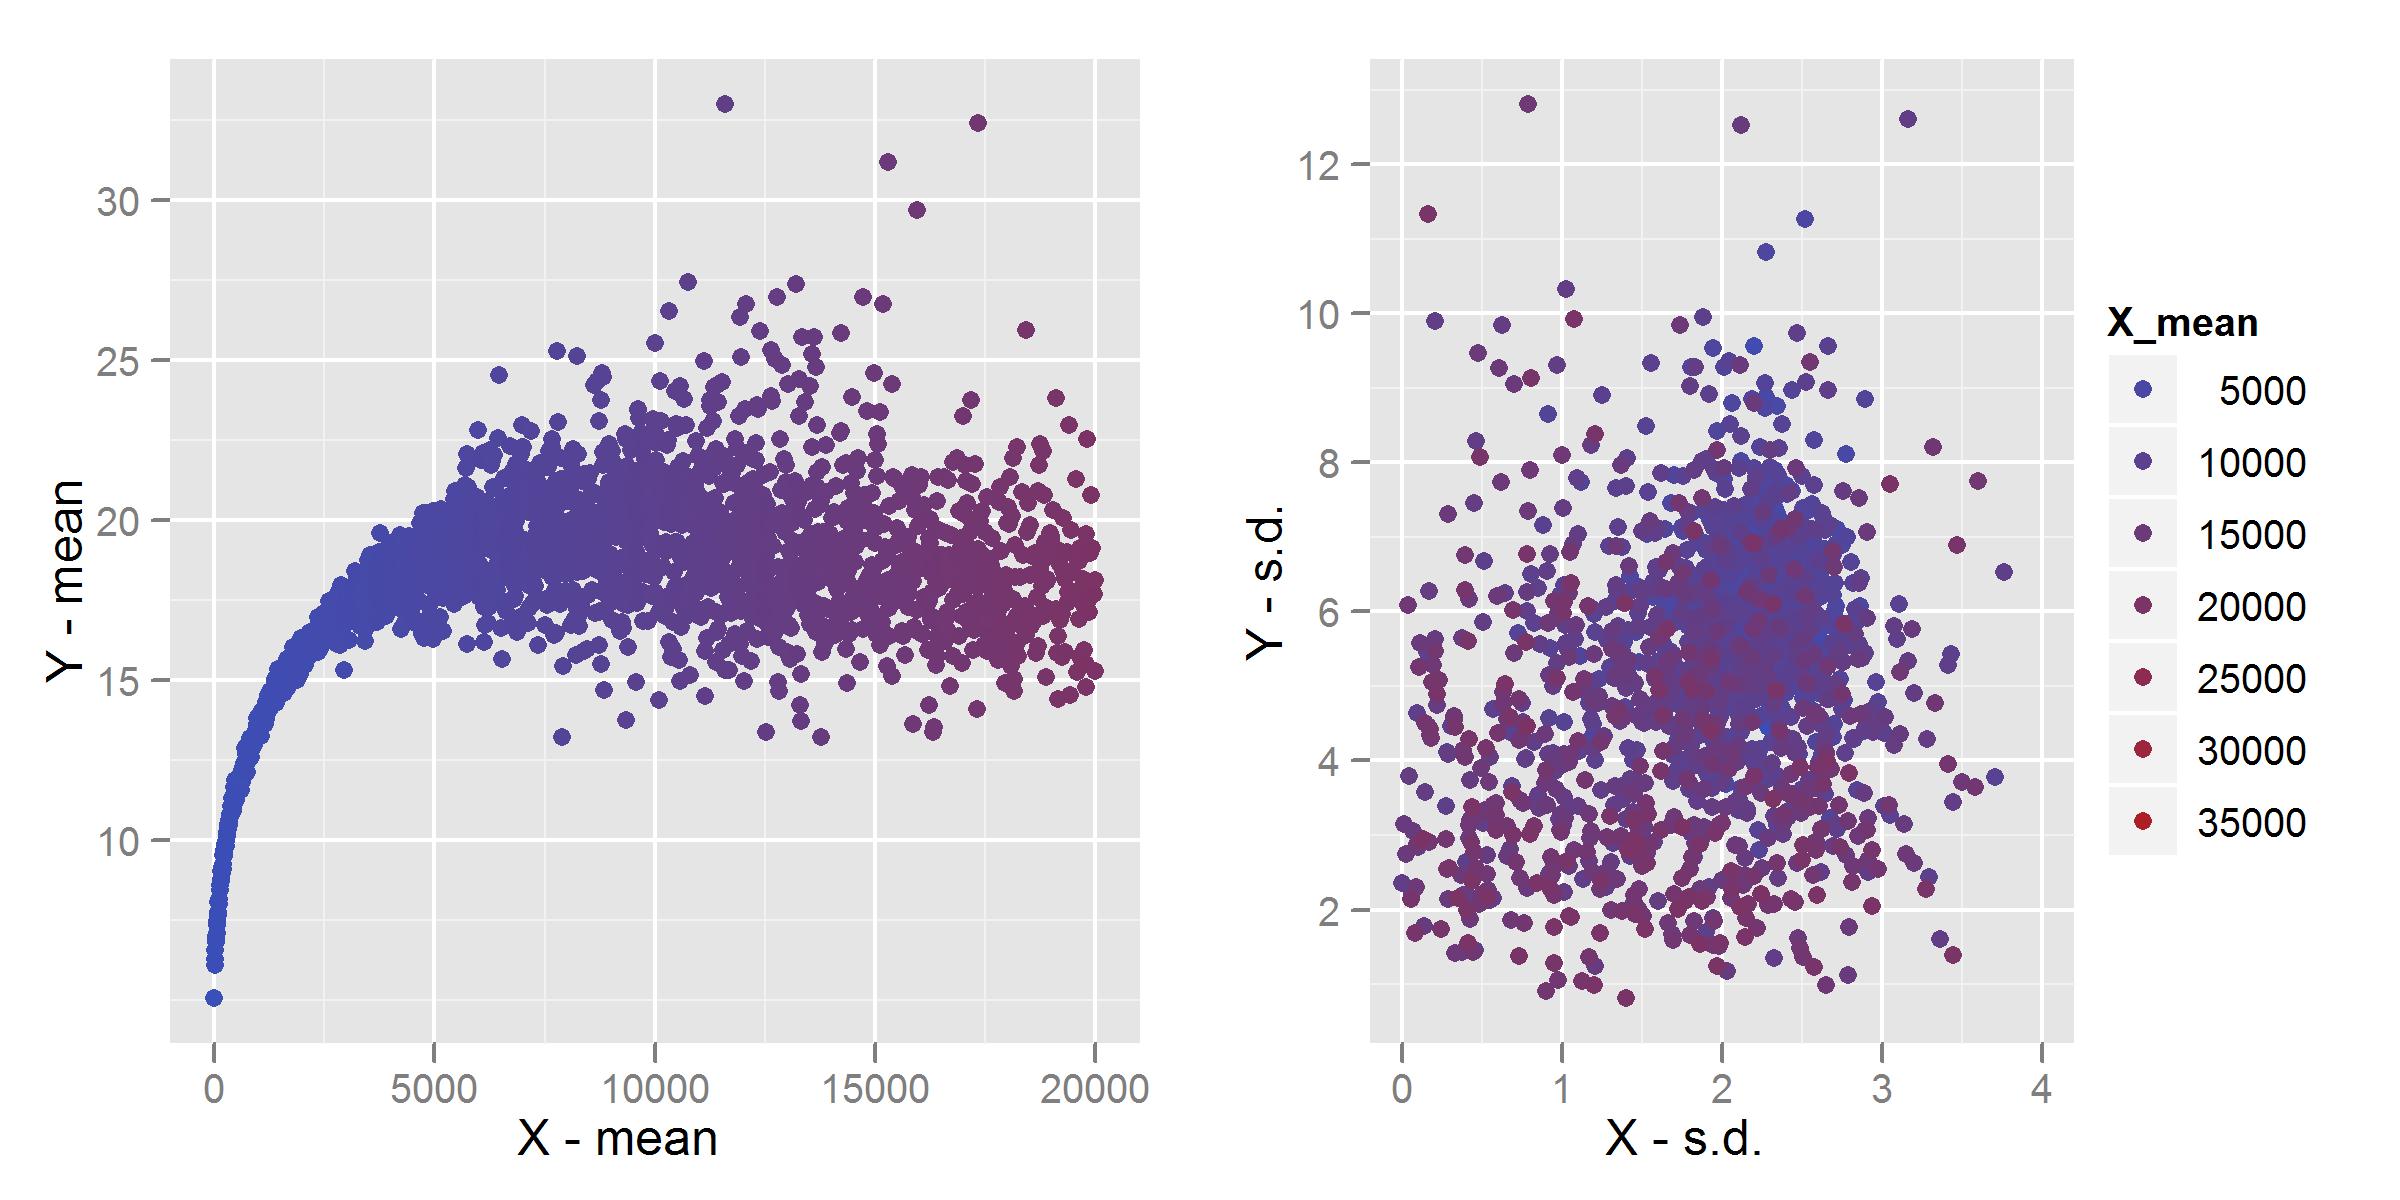
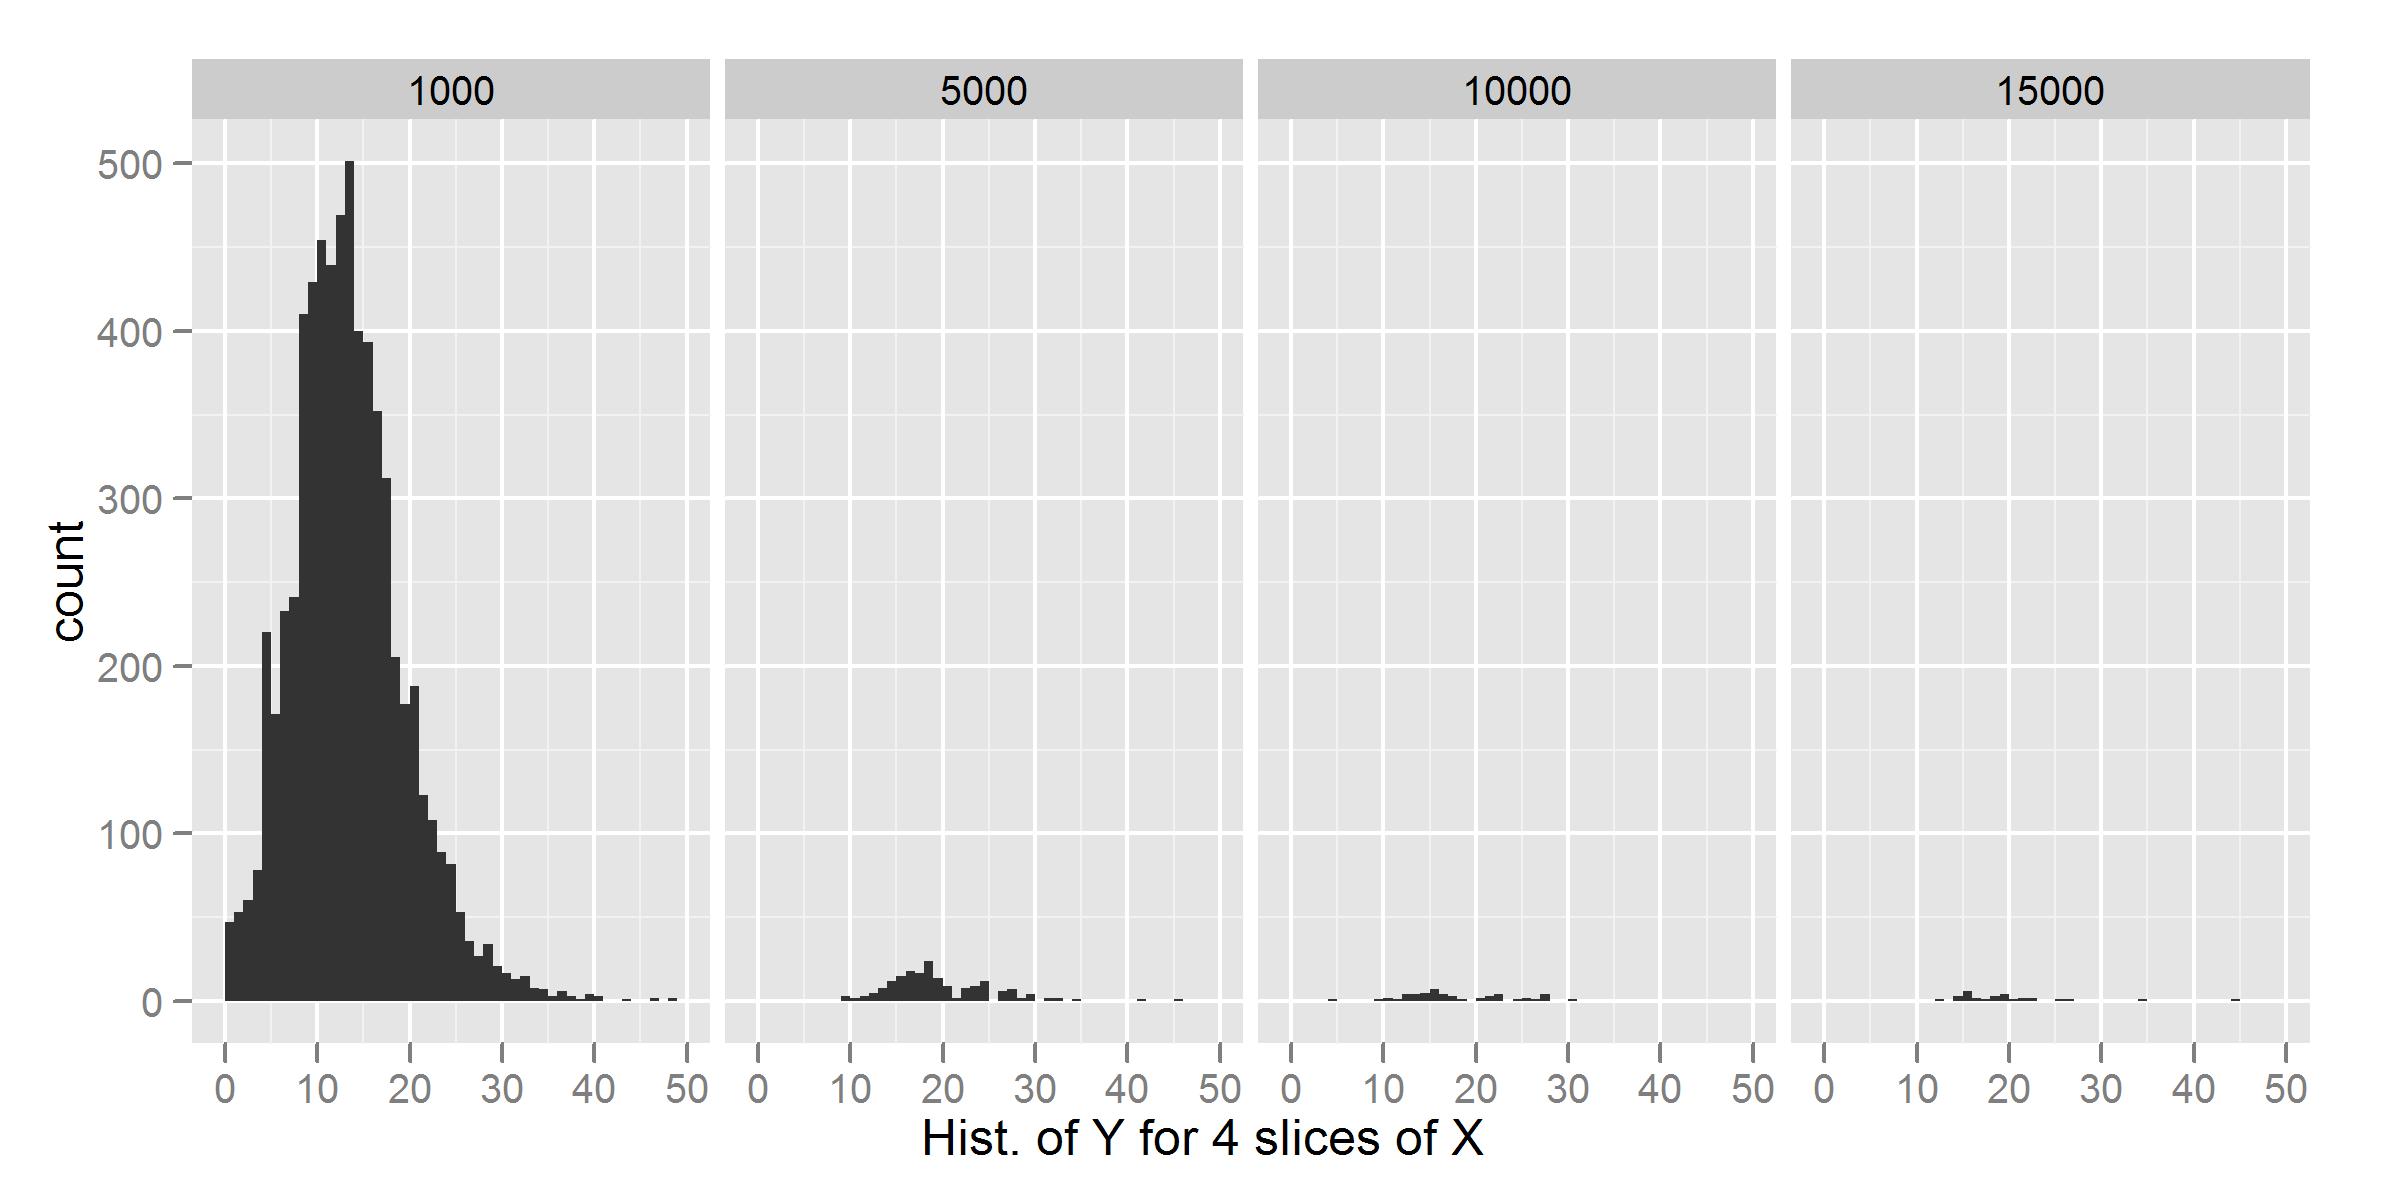
Following some suggestions from @whuber and @jbowman I have included some more graphics of the dataset. These are plots of the mean and standard deviation binned by groups of 8 (e.g. 0 - 8, 8 - 16), and a histogram of slices through the data at 4 intervals.

I colored the plots by the value of X-mean so that it is clear that greater variation occurs for higher X values.
Histogram of slices through the data (again using a binwidth of 8):

