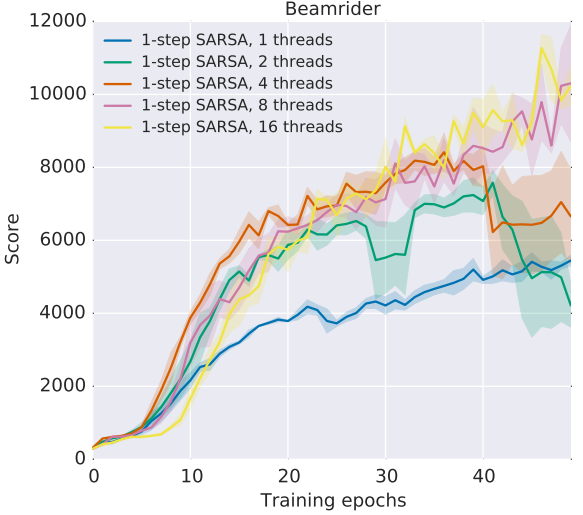
I've often seen a less informative but simpler alternative to boxplots where the error is assumed to be Gaussian and the plot shows the mean as a line with the surface of one standard deviation above and below it filled semi-transparently, as shown below.
Now, the surfaces in this kind of chart can cover impossible values. For example, when the minimum value is zero, the area might cover negative values.
Intuitively, I would just compute the standard deviation of all values above and all below the mean individually, and plot the area between those values. However, is there is a common distribution family for this error assumption?
(From: Mnih, Volodymyr, et al. Asynchronous methods for deep reinforcement learning. arXiv preprint arXiv:1602.01783. 2016.)

