(source https://en.wikipedia.org/wiki/Loss_functions_for_classification)
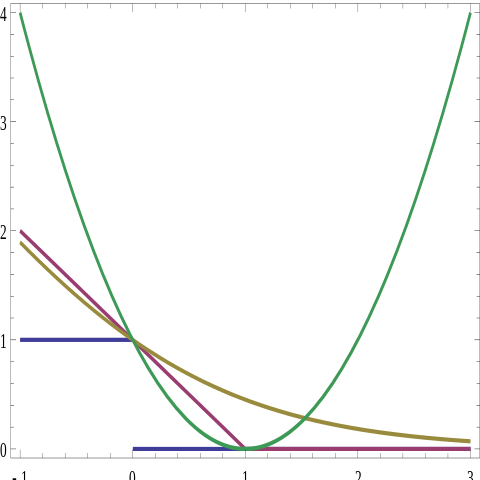
A bit confused on how to interpret this: I understand that outputs $Y$ are mapped to {-1,1}, and that the y-axis here refers to error/cost. What exactly does it mean to say that the vector of all possible value has been mapped to 0 on the x-axis, thus producing an error of 1?
If the x-axis refers to possible outputs, why does it extend beyond 1? If it's about the probability of choosing correctly, why does it go below 0?

