Clarified question
Source Link

enter image description here

(source https://en.wikipedia.org/wiki/Loss_functions_for_classification)

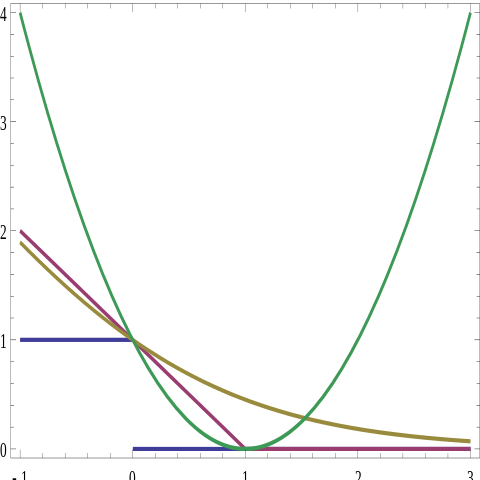
A bit confused on how to interpret this: graph. I understand that the y-axis here refers to loss, which is a function of the product of the predicted label and the actual label.

What exactly doesI also understand that the x-axis refer torepresented by $y_i f(x_i)$. $y = \{-1, 1\}$ represents the possible values of the binary output.

So then, why would $y_i f(x_i)$ ever exceed 1? If $f(x)$ represents the probabilities of $y$ = 1, then it shouldn't leave the bounds {-1,1}.

An example would be great appreciated.

enter image description here

(source https://en.wikipedia.org/wiki/Loss_functions_for_classification)

A bit confused on how to interpret this: I understand that the y-axis here refers to loss, which is a function of the product of the predicted label and the actual label.

What exactly does the x-axis refer to?

enter image description here

(source https://en.wikipedia.org/wiki/Loss_functions_for_classification)

A bit confused on how to interpret this graph. I understand that the y-axis here refers to loss, which is a function of the product of the predicted label and the actual label.

I also understand that the x-axis represented by $y_i f(x_i)$. $y = \{-1, 1\}$ represents the possible values of the binary output.

So then, why would $y_i f(x_i)$ ever exceed 1? If $f(x)$ represents the probabilities of $y$ = 1, then it shouldn't leave the bounds {-1,1}.

An example would be great appreciated.
Edited for clarity and current understanding
Source Link

enter image description here

(source https://en.wikipedia.org/wiki/Loss_functions_for_classification)

A bit confused on how to interpret this: I understand that outputs $Y$ are mapped to {-1,1}, and that the y-axis here refers to error/cost. What exactly does it mean to say that the vectorloss, which is a function of all possible value has been mapped to 0 on the x-axis, thus producing an errorproduct of 1?the predicted label and the actual label.

IfWhat exactly does the x-axis refersrefer to possible outputs, why does it extend beyond 1? If it's about the probability of choosing correctly, why does it go below 0?

enter image description here

(source https://en.wikipedia.org/wiki/Loss_functions_for_classification)

A bit confused on how to interpret this: I understand that outputs $Y$ are mapped to {-1,1}, and that the y-axis here refers to error/cost. What exactly does it mean to say that the vector of all possible value has been mapped to 0 on the x-axis, thus producing an error of 1?

If the x-axis refers to possible outputs, why does it extend beyond 1? If it's about the probability of choosing correctly, why does it go below 0?

enter image description here

(source https://en.wikipedia.org/wiki/Loss_functions_for_classification)

A bit confused on how to interpret this: I understand that the y-axis here refers to loss, which is a function of the product of the predicted label and the actual label.

What exactly does the x-axis refer to?

added 20 characters in body
Source Link
Tim
  • 141.2k
  • 26
  • 270
  • 512

See:enter image description here

(source https://en.wikipedia.org/wiki/Loss_functions_for_classification#/media/File:Loss_function_surrogates.svghttps://en.wikipedia.org/wiki/Loss_functions_for_classification)

A bit confused on how to interpret this: I understand that outputs $Y$ are mapped to {-1,1}, and that the y-axis here refers to error/cost. What exactly does it mean to say that the vector of all possible value has been mapped to 0 on the x-axis, thus producing an error of 1?

If the x-axis refers to possible outputs, why does it extend beyond 1? If it's about the probability of choosing correctly, why does it go below 0?

Just a bit confused by this.

See: https://en.wikipedia.org/wiki/Loss_functions_for_classification#/media/File:Loss_function_surrogates.svg

A bit confused on how to interpret this: I understand that outputs $Y$ are mapped to {-1,1}, and that the y-axis here refers to error/cost. What exactly does it mean to say that the vector of all possible value has been mapped to 0 on the x-axis, thus producing an error of 1?

If the x-axis refers to possible outputs, why does it extend beyond 1? If it's about the probability of choosing correctly, why does it go below 0?

Just a bit confused by this.

enter image description here

(source https://en.wikipedia.org/wiki/Loss_functions_for_classification)

A bit confused on how to interpret this: I understand that outputs $Y$ are mapped to {-1,1}, and that the y-axis here refers to error/cost. What exactly does it mean to say that the vector of all possible value has been mapped to 0 on the x-axis, thus producing an error of 1?

If the x-axis refers to possible outputs, why does it extend beyond 1? If it's about the probability of choosing correctly, why does it go below 0?

Source Link
Loading