(source https://en.wikipedia.org/wiki/Loss_functions_for_classification)
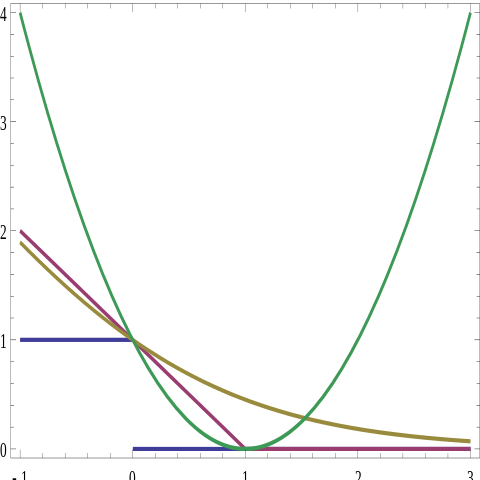
A bit confused on how to interpret this: I understand that the y-axis here refers to loss, which is a function of the product of the predicted label and the actual label.
What exactly does the x-axis refer to?

