I'm attempting to understand what the survivor and hazard functions describe under a non-traditional context. I have data comprising distances between successive points on a line ($1D$ vector):
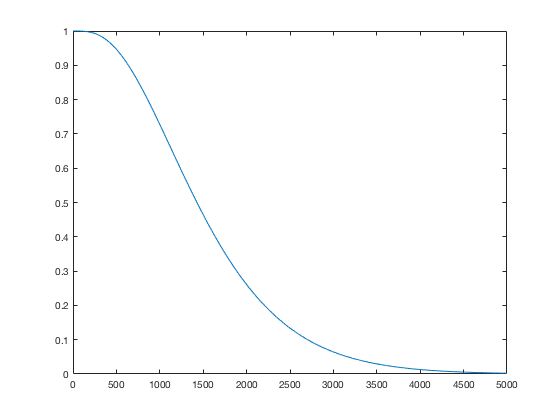
Traditionally in my field, such data is fitted with a gamma-distribution in an attempt to describe the distribution of the points. For example, such data may yield a best-fit (MLE) gamma of $\alpha = 3.5$, $\beta = 450$. In plotting this distribution as a survivor function, I obtain:
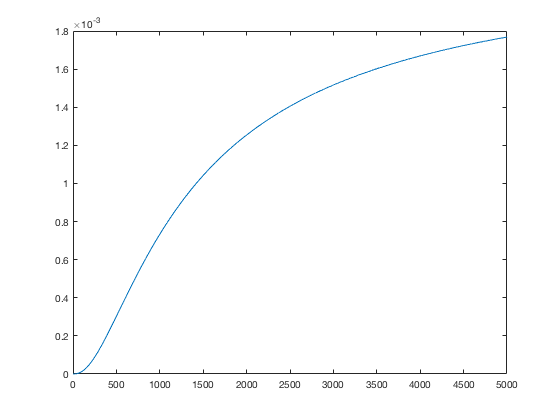
And as a hazard function:
Under this context, what is each plot describing? It was my understanding that the hazard function could be understood as describing the probability of finding another point when a point already exists at $x(0)$ i.e. the further away from a pre-existing point you go, the higher the chance is that you will encounter another point. However, I am not entirely sure if this is correct.
With regards to the survivor function, I'm struggling to translate the typical descriptions of it (regarding time, populations etc.) into a more applicable understanding.
Any help would be greatly appreciated.


