I have created couple of graphs in R
d5 <- scan('d500.txt')
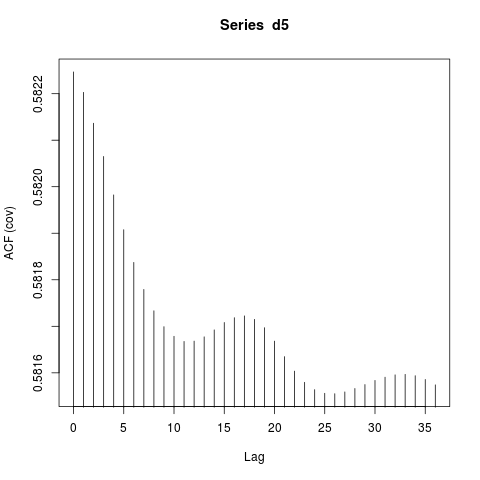
p1 <- acf(d5,lag.max = 36 ,type = c("covariance"),plot = TRUE)
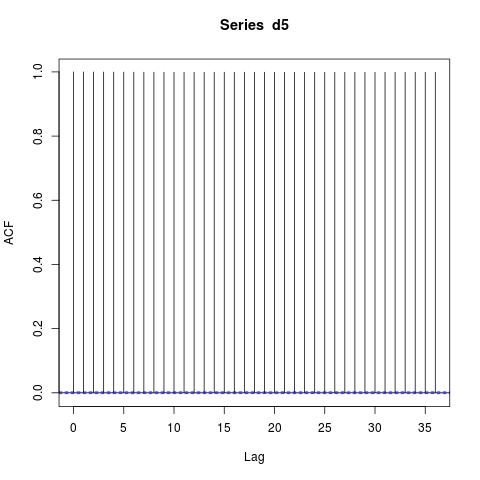
Then the next one is correlation
p1 <- acf(d5,lag.max = 36 ,type = c("correlation"),plot = TRUE)
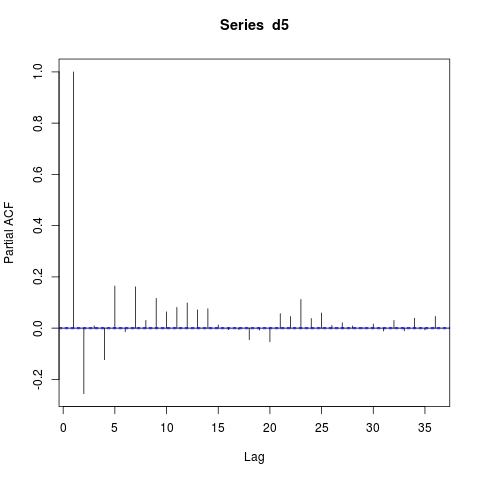
And pacf
p1 <- pacf(d5,lag.max = 36 ,plot = TRUE)
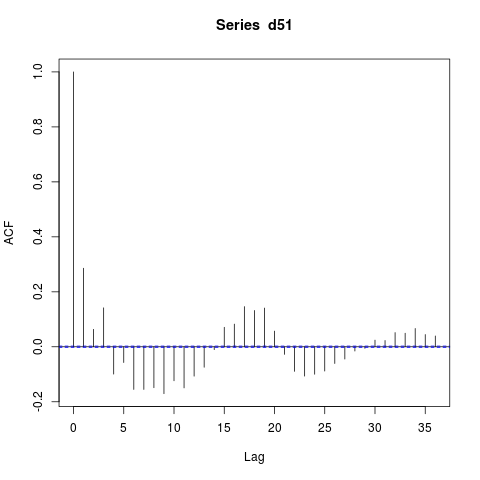
If I take a one difference operation
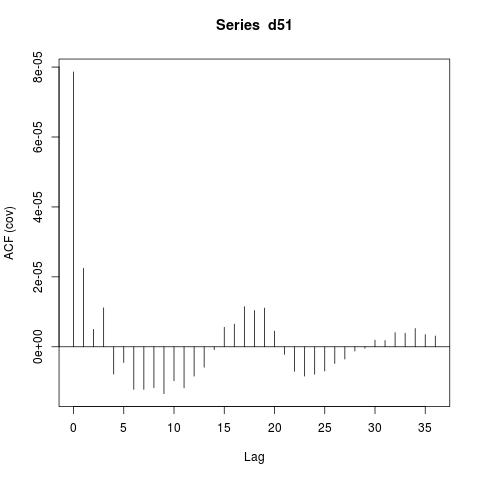
d51 <- diff(d5)
p1 <- acf(d51,lag.max = 36 ,type = c("correlation"),plot = TRUE)
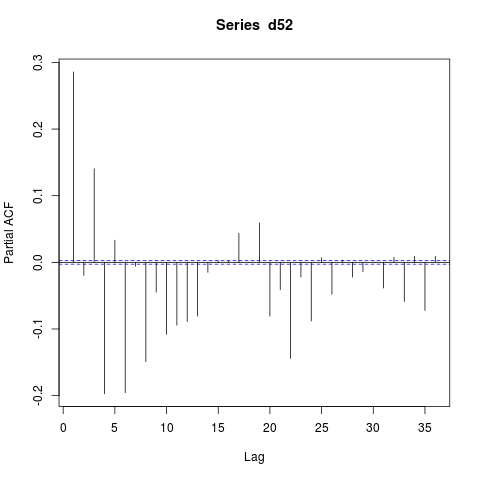
and pacf
How to interpret this?What does sinusoidal acf(cov) shows? Original data set is here

