Writing the whole problem, to avoid asking a question when in reality I needed an answer to a whole different question, and just didn't know how to ask.
I have no idea where to start, I can program stuff in python, but I don't have much(possibly any) knowledge in statistics.
I have a log of my body temperature over the last 4 months, but I only logged it sometimes, when I felt bad i. e. - Not all days have values and the timing of measurement is irregular. So, if a day doesn't have a value it means I forgot to log it, I felt good - it's assumed it was around 36.6C etc. Or for example if I felt pain somewhere - if it has an entry it means I felt it and no entry means either no pain or I forgot, since the logging wasn't perfect.
So, when comparing these types of series to other series, should I pad them with default values in between or leave them as they are?
I also have a bunch of other measurements like what food I ate, how long I've slept, and logs of other important regular events.
Each entry has a timestamp and is either of type(value - hours slept, mood level) or of type - happened and logged or not logged at all.
I have a lot of them and I would like to find those that correlate between each other, so, say I have
Temperature in Celsius
2018-05-29 11:59:00   35.7
2018-05-29 20:42:00   36.7
2018-05-29 21:23:00   36.6
2018-05-29 23:20:00   36.9
2018-05-30 11:03:00   35.8
2018-05-30 21:08:00   36.8
2018-05-30 23:34:00   36.7
2018-05-31 01:27:00   36.8
2018-05-31 17:32:00   36.4
2018-05-31 20:41:00   36.5
2018-06-01 01:05:00   37.0
2018-06-01 01:09:00   37.2
2018-06-01 01:40:00   36.7
2018-06-01 14:10:00   36.8
2018-06-01 15:58:00   36.6
2018-06-01 16:59:00   36.2
2018-06-01 22:11:00   36.1
2018-06-02 03:08:00   36.1
Eating something sweet
2018-05-21 20:29:00    1.0
2018-05-21 22:12:00    1.0
2018-05-21 23:47:00    1.0
2018-05-24 23:19:00    1.0
2018-05-25 15:59:00    1.0
2018-05-29 20:01:00    1.0
2018-05-30 01:51:00    1.0
2018-06-02 19:28:00    1.0
2018-06-03 20:29:00    1.0
Some other measurement that has values between -5 and 3
2018-05-27 21:30:00   -1.0
2018-05-27 21:58:00    0.0
2018-05-27 22:44:00   -2.0
2018-05-28 00:54:00   -1.0
2018-05-28 23:17:00    1.0
2018-05-29 13:09:00   -1.0
2018-05-29 19:23:00   -1.0
2018-05-29 21:46:00   -1.0
2018-05-30 20:23:00   -1.0
2018-05-31 13:38:00   -1.0
2018-05-31 15:19:00   -1.0
2018-05-31 17:08:00   -1.0
2018-05-31 18:27:00    0.0
2018-05-31 20:39:00   -1.0
2018-06-01 20:07:00   -2.0
2018-06-02 12:36:00   -1.0
2018-06-02 12:52:00   -3.0
2018-06-03 14:45:00   -2.0
2018-06-03 15:16:00   -1.0
And lots of the same sort, around 100 and more of not regularly occurring events, how do I check each one of them against each other for correlation?
I can think of trying to transforming them into averages over a day, or number of entries per day for just event tracker without value. But it can be done later. I need some help with giving me directions where to look and what to read and what to try.
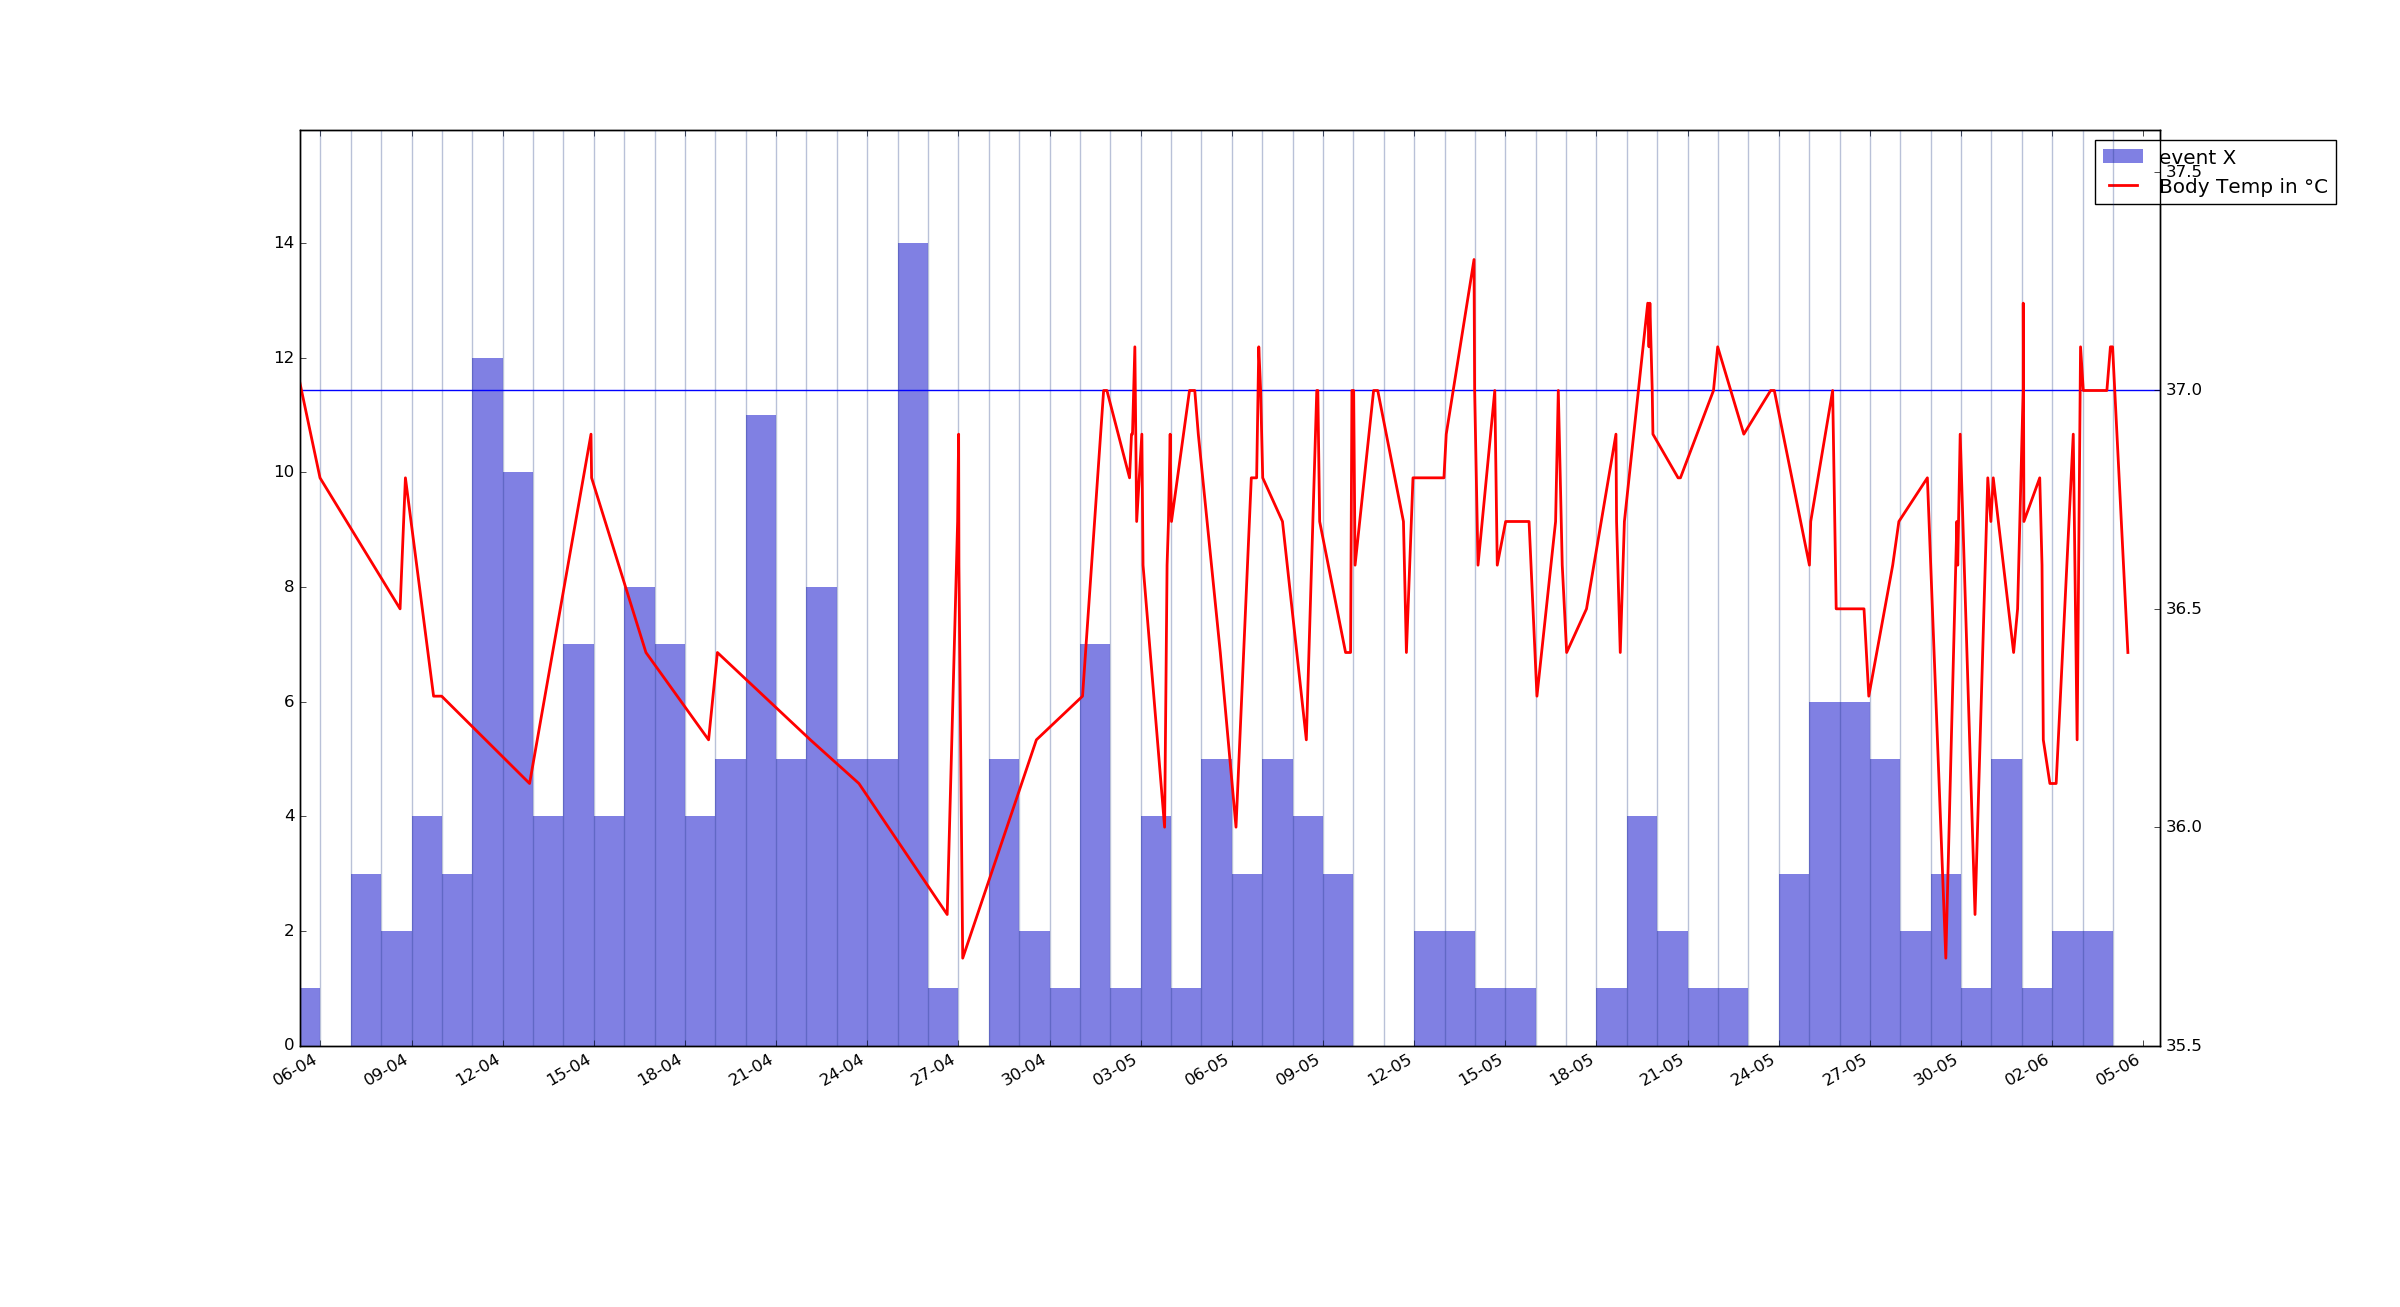
As an example, here's a plot of my body temperature and a barplot of event X grouped by 24hour intervals over last 2 months. I want to know if they are correlated or not. event X has a precise time of logging and a value connected to it - from -5 to 3 but I'm not sure how to visualize it best yet.

